Corporate Bankruptcy Recap & Forecast: Downward Trend Continues while Prepackaged Reorganizations Rise in 2013

Boston, MA (PRWEB) January 10, 2014 -- BankruptcyData.com’s research reveals that 71 publicly traded* companies filed for bankruptcy protection in 2013 with a total of $42.6 billion in combined total pre-petition assets**. This filing count is down from 2012’s 87 filings and $70.8 billion in assets. The largest filing of 2013 was Cengage Learning’s $7.5 billion bankruptcy, followed by Penson Worldwide with $6.2 billion in assets then a sharp drop to Dex One’s $2.8 billion filing. The attached chart reflects the ten largest Chapter 7 and Chapter 11 proceedings for 2013. Coincidentally, these are the only bankruptcies for the year that listed $1 billion or more in total pre-petition assets.
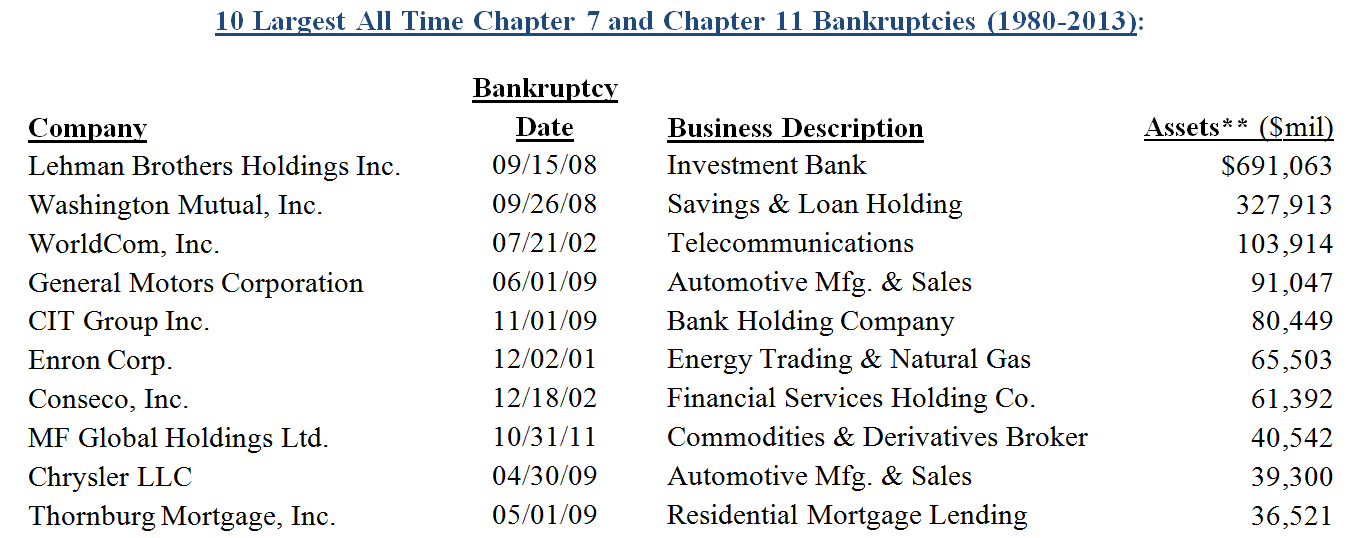
The average pre-petition asset figure also continued its downward trend, dropping to $600 million—compared to $814 million in 2012. In fact, the total asset figure for the two largest bankruptcies combined still does not equal that of the largest filing of 2012—Residential Capital, which had more than $15 billion in assets—and none of this year’s bankruptcies come close to ranking on BankruptcyData.com’s list of largest all-time bankruptcy filings (also attached).
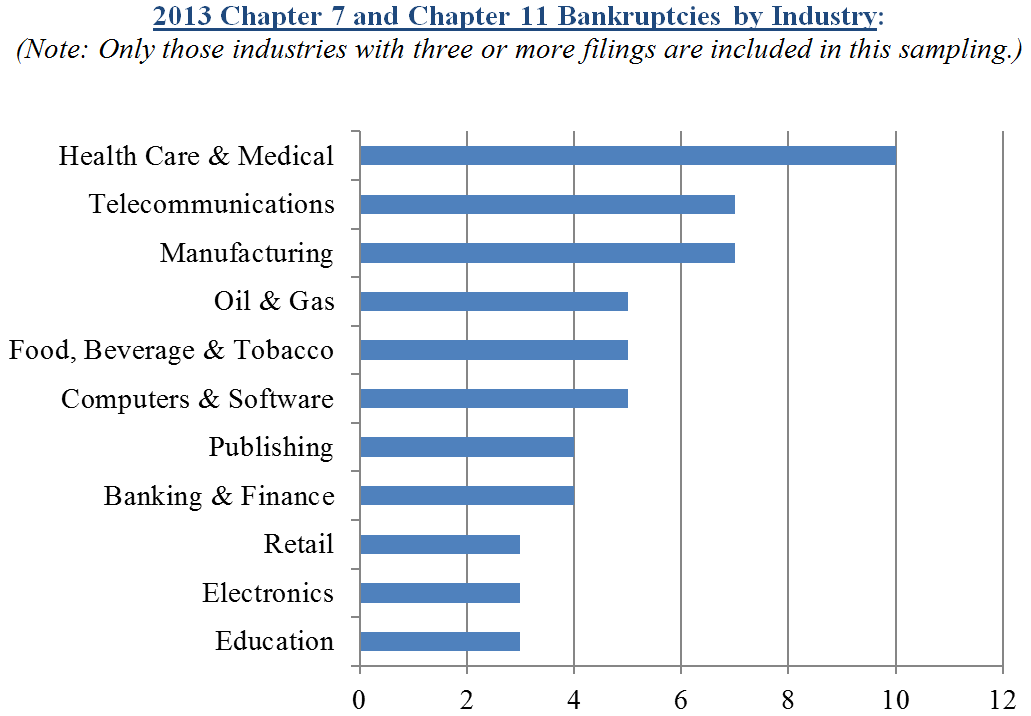
Continuing a trend we’ve seen over the past few years—and unlike the bankruptcy cycles of (1) 2000-03 and (2) 2008-09, which were clearly dominated by certain industry groups (telecom/technology and financial services, respectively), 2013’s Chapter 11 activity covered a wide range of industries. As was the case in 2012, health care & medical industry bankruptcies once again led this year’s filing count with ten bankruptcies (or approximately 15% of the total filings) coming from this sector (with total combined assets of $1.2 billion).
In terms of asset size, filings from the health care & medical industry do not measure up to those from the banking & finance, education and publishing sectors, which reported combined total assets of $9.5 billion, $8.2 billion and $6.3 billion, respectively despite their respective bankruptcy counts of just four, three and four. It should be noted that many filings within the financial sector, which typically report a higher pre-petition asset figure than other industries, reflect a tremendous asset discrepancy between the date on which a company files its most recent pre-petition Annual Report and its bankruptcy date. This variance often can be explained by Federal Deposit Insurance Corporation (FDIC) closures and subsequent third party bank asset acquisitions.
Other significant industry representations in 2013 include the following: telecommunications: seven bankruptcy filings/$1.5 billion in assets; manufacturing; seven bankruptcy filings/$3.0 billion in assets; oil & gas: five bankruptcy filings/$1.7 billion in assets and computers & software: five bankruptcy filings/$575 million in assets. The attached graphic provides an overview of 2013’s bankruptcy activity by industry.
While statistical analysis reveals that bankruptcy activity has generally slowed over the past several years, many wonder if this trend will continue in 2014. George Putnam, III, Founder of New Generation Research, anticipates a change. Putnam explains, “Even with the strength in the markets, there are a number of companies that raised large amounts of debt prior to 2008 that have not yet refinanced or restructured that debt. Many of those debt issues come due over the next few years, and we think a significant number of those issuers will have trouble refinancing.”
Putnam continues, “In addition, there has been a huge amount of new high yield debt issued since 2009. History shows us that a meaningful percentage of high yield debt usually defaults within four years of issuance. Even if only a small percentage of the debt issued over the last four years goes into default, that is likely to generate a significant surge in bankruptcy filings. It is difficult to predict exactly when defaults and bankruptcies will pick up again, but we are confident it will happen in the not-too-distant future.”
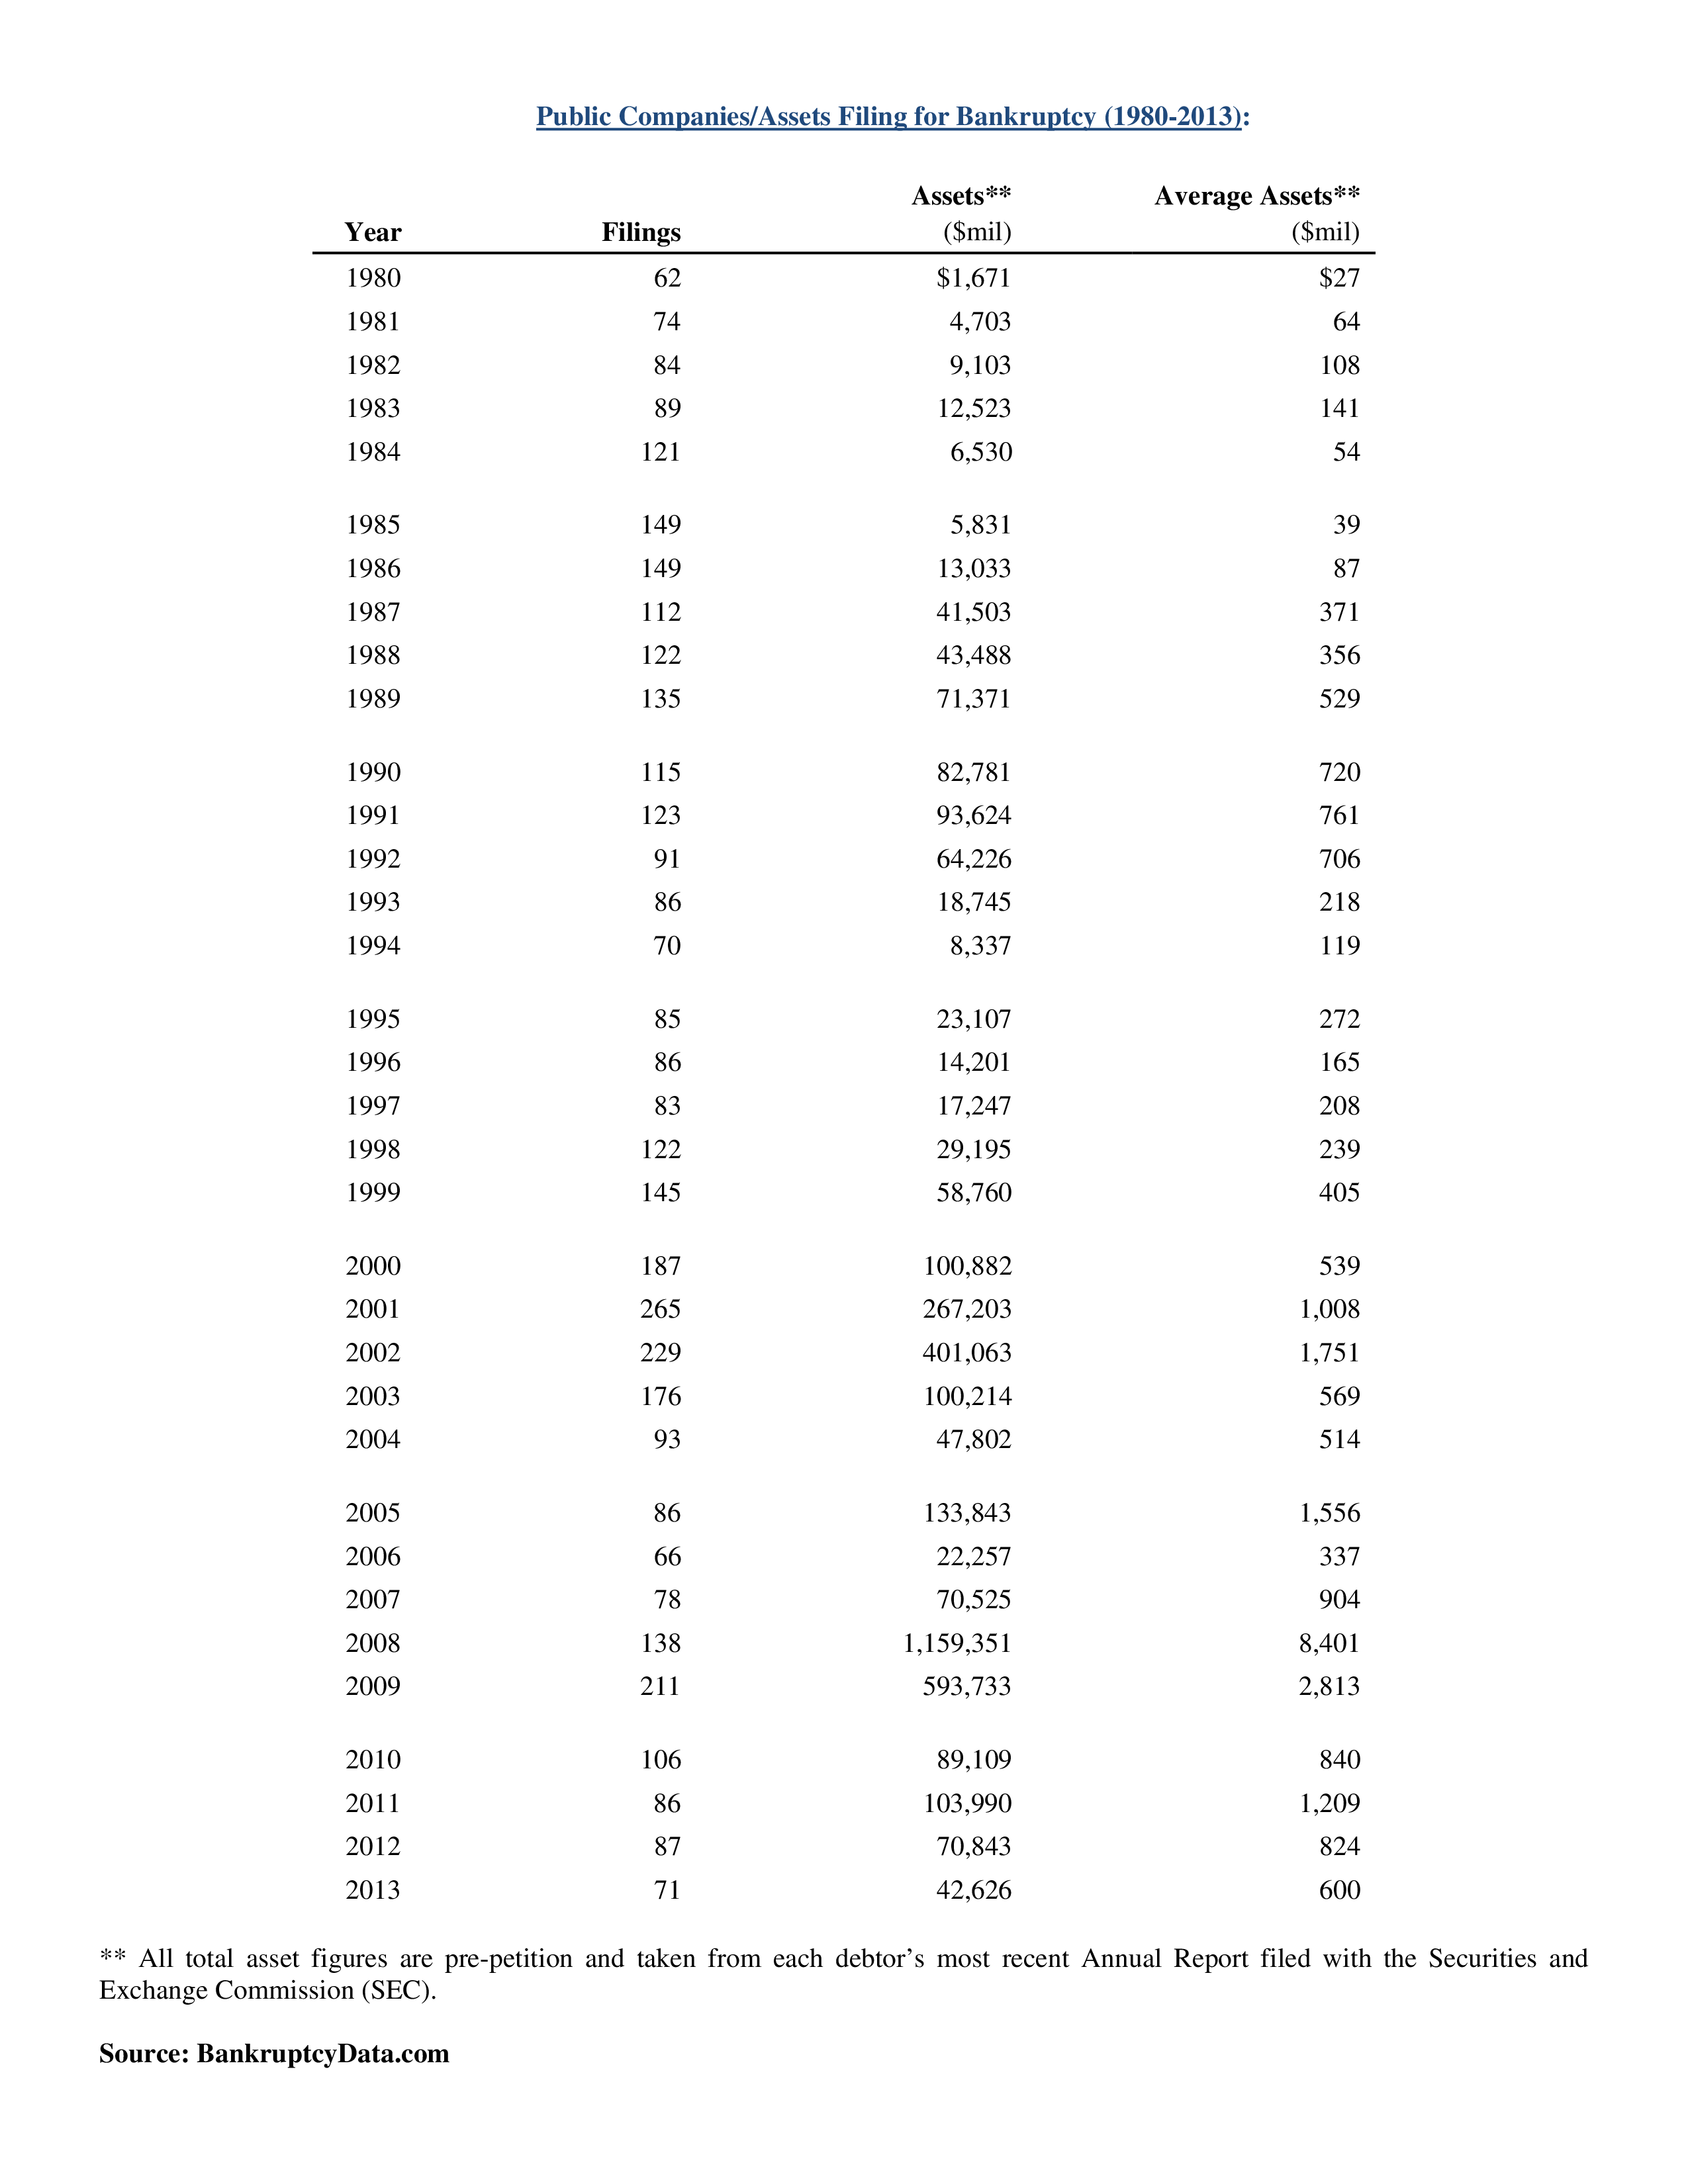
Despite the decrease in the actual number of filings, there has been an increase in the number of prepackaged (Plan of Reorganization filed concurrently with the Petition) or pre-negotiated (company has initiated pre-petition creditor negotiations) bankruptcy filings over the past few years, and many companies are now opting for this streamlined approach or simply restructuring outside the parameters of a U.S. Bankruptcy Court proceeding. In fact, BankruptcyData.com’s research reveals that there were a total of 17 prepackaged Chapter 11 proceedings in 2013, versus eleven in 2012 and just four in 2011—with respective combined total asset figures of $14 billion, $8 billion and $3 billion. The attached chart offers historical context on both the number and size of public Chapter 7 and Chapter 11 bankruptcy filing activity dating back to 1980.
- BankruptcyData.com defines publicly traded as those companies with common stock and/or bonds that are publicly-traded on U.S. markets.
** All total asset figures are pre-petition and taken from each debtor’s most recent Annual Report filed with the Securities and Exchange Commission (SEC).
*** Indicates that the company has made more than one bankruptcy filing.
Disclaimer: BankruptcyData.com collects its information from the U.S. Bankruptcy Court, SEC and FDIC. Although all sources are believed to be reliable, accuracy cannot be guaranteed. New Generation Research thoroughly analyzed and audited all bankruptcy figures and statistics; however, certain details may require adjustment pending untimely SEC reporting and/or delayed U.S. Bankruptcy Court docketing.
***********************************************
Media is welcome and invited to reproduce information provided in this release and/or taken from BankruptcyData.com’s Research Center—with appropriate sourcing to corporate bankruptcy data provider BankruptcyData.com. Additional statistics and/or queries are available upon media request.
BankruptcyData.com, a division of New Generation Research, Inc., provides news, retention data, financial history, creditor information, reorganization plan summaries and more for publicly traded companies that have filed for bankruptcy protection since 1980. Its extensive databases can be searched by assets, industry, filing date and company name.
New Generation Research, Inc.
1212 Hancock Street, LL-15; Quincy, MA 02169, (617) 573-9550
http://www.BankruptcyData.com
[email protected]
Follow us for breaking news: Facebook| Twitter
Linzee Brown, New Generation Research, Inc., +1 (617) 573-9550 Ext: 558, [email protected]
Share this article