The NPD Group Reports on U.S. Toy Industry Retail Sales for 2014

PORT WASHINGTON, NEW YORK (PRWEB) January 21, 2015 -- According to retail sales data from global information company, The NPD Group, U.S. retail sales of toys generated $18.08 billion in 2014 compared to $17.46 billion in 2013, an increase of 4 percent.*
Retail sales over the 2014 holiday shopping season got off to a bumpy start, with the weeks of Black Friday and Cyber Monday experiencing mixed results of -2 percent and 1 percent (compared to the same time periods in 2013). However, with one extra shopping day the week of Christmas compared to last year, Christmas week grew 27 percent, lifting December growth to 6 percent. Fourth quarter sales (Oct.-Dec. 2014) were up 3 percent.**
“From Black Friday week to the week before Christmas, holiday toy sales were looking relatively flat,” said Juli Lennett, president of the Toys division at The NPD Group. “But with the procrastinators shopping in droves the days before Christmas, perhaps aided by plunging gas prices, the toy industry experienced a merry Christmas after all.”
In terms of sales performance across super-categories in 2014, Building Sets and Youth Electronics experienced the most significant increases at 13 percent and 11 percent, respectively, followed by Action Figures and Games/Puzzles, both increasing 9 percent. Infant/Preschool Toys and All Other Toys were the only categories to experience dollar sales declines when compared to 2013 (-5 percent and -0.4 percent, respectively).
Licensed toys, which represented 31 percent of total industry sales, experienced an increase of 7 percent in 2014 compared to 2013.
Looking at top toy properties, Disney’s Frozen captured the top spot overall as well as the top gainer among all toy properties for the year based on absolute dollar growth, generating $531 million in 2014. While Frozen did not capture the top spot in any of the 11 super-categories NPD tracks, and was the top property in only four of the 100 subclasses (Paint Kits, Fashion Styling & Dress-up, Children’s Puzzles, Electronic Entertainment), the property was represented in 39 different toy categories.
“Frozen was the big news story in the toy industry in 2014,” said Lennett. “It wasn’t due to that one hot toy that was a category killer, but because of the varied breadth and sheer number of toys. Frozen had over 300 different items on store shelves this year.”
*Data is representative of retailers that participate in The NPD Group's Retail Tracking Service. NPD’s current estimate is that the Retail Tracking Service represents approximately 80 percent of the U.S. retail market for Toys.
2014 data = 52 weeks starting January 5, 2014 through week ending January 3, 2015; 2013 data = 52 weeks starting January 6, 2013 through week ending January 4, 2014.
** Oct-Dec 2014 data = 13 weeks starting October 5, 2014 through week ending January 3, 2015;
Oct-Dec 2013 data = 13 weeks starting October 6, 2013 through week ending January 4, 2014.
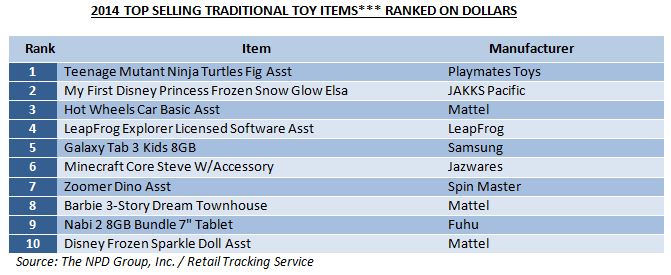
***These lists capture all widely distributed SKUs sold in the U.S. by retailers (including e-tailers). The lists do not include items that are exclusive to specific retailers.
About The NPD Group, Inc.
The NPD Group provides global information and advisory services to drive better business decisions. By combining unique data assets with unmatched industry expertise, we help our clients track their markets, understand consumers, and drive profitable growth. Sectors covered include automotive, beauty, consumer electronics, entertainment, fashion, food / foodservice, home, luxury, mobile, office supplies, sports, technology, toys, and video games. For more information, visit npd.com and npdgroupblog.com. Follow us on Twitter:@npdgroup.
David Riley, The NPD Group, http://www.npd.com, 917-543-5465, [email protected]
Share this article