
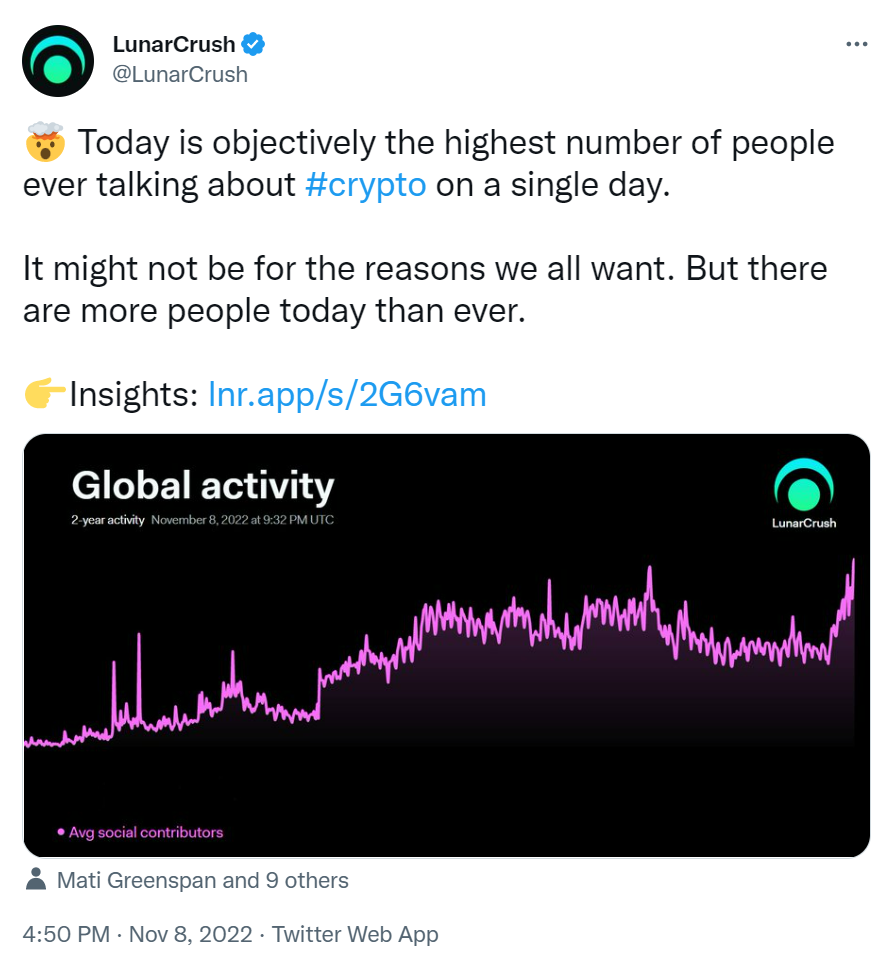
Global cryptocurrency social contributors, social mentions, and social engagement reaches all time high.
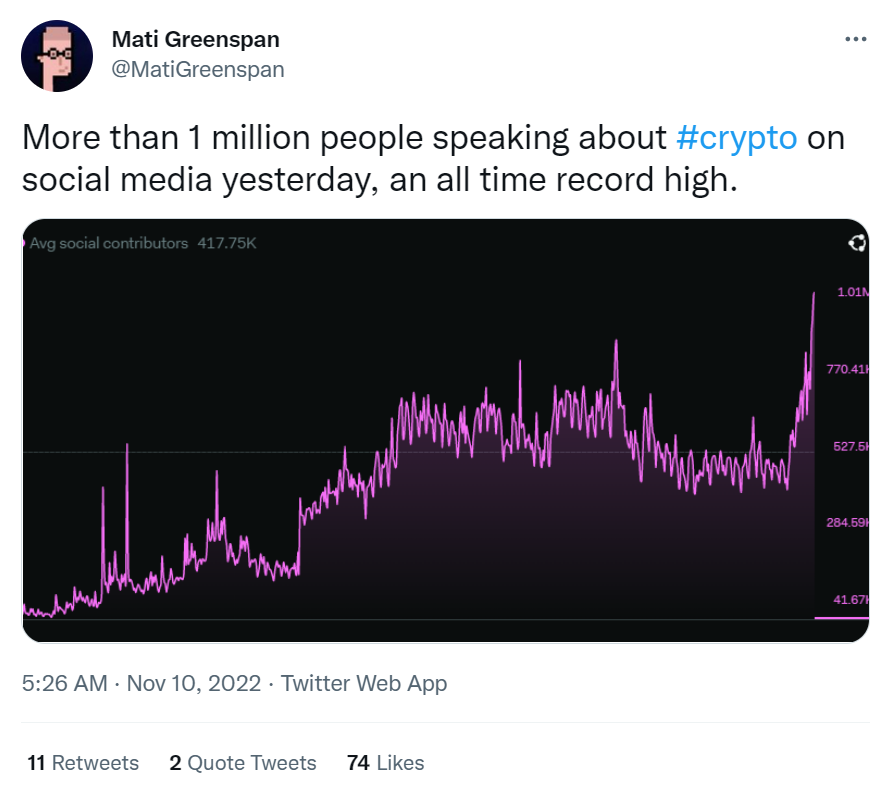
COSTA MESA, Calif., Nov. 10, 2022 /PRNewswire-PRWeb/ -- LunarCrush, a social intelligence company, announced today that the metrics around social contributions, social mentions, and social engagement reached an all time high due to the conversations surrounding the failure of FTX - the second largest cryptocurrency exchange. Social mentions started to climb on October 28th and increased to a fever pitch today November 9th. On the 28th, it averaged around 400,000 - 500,000 total social contributors, as of November 9th there were more than 1 million. The million people speaking about crypto resulted in 2.4 million total crypto mentions (avg 1.8 million) and 6.9 billion engagements (avg 4.6 billion) across social platforms. This increase in conversation correlates with volatile price action across a spectrum of cryptocurrencies.
"The conversations around FTX and crypto far overwhelm any other crypto related event this year," said Joe Vezzani, Chief Executive Officer at LunarCrush. "This comes at a time where we saw Terra, Celsius, Three-arrows, and numerous others fail in 2022. For crypto, this is no different than the banks failing in 2008, the only difference being the taxpayers aren't stuck with the bill. It's still a better system in the making."
"With social activity at an all time high, we're seeing wild volatility activity across nearly the entire crypto market," said Jon Farjo, Chief Product Officer at LunarCrush. "With social media being the source for breaking news for everything that's happening with FTX, we've seen a massive spike in conversations. As information is breaking at a rapid pace, it seems like everyone has a hot take on this one. Those takes have created a lot of price movement, de-risking, and ultimately trust issues across the crypto market."
Here's a full breakdown of charts and graphs to show activity across all of social media, conversations around FTX, and spikes in $SOL activity.
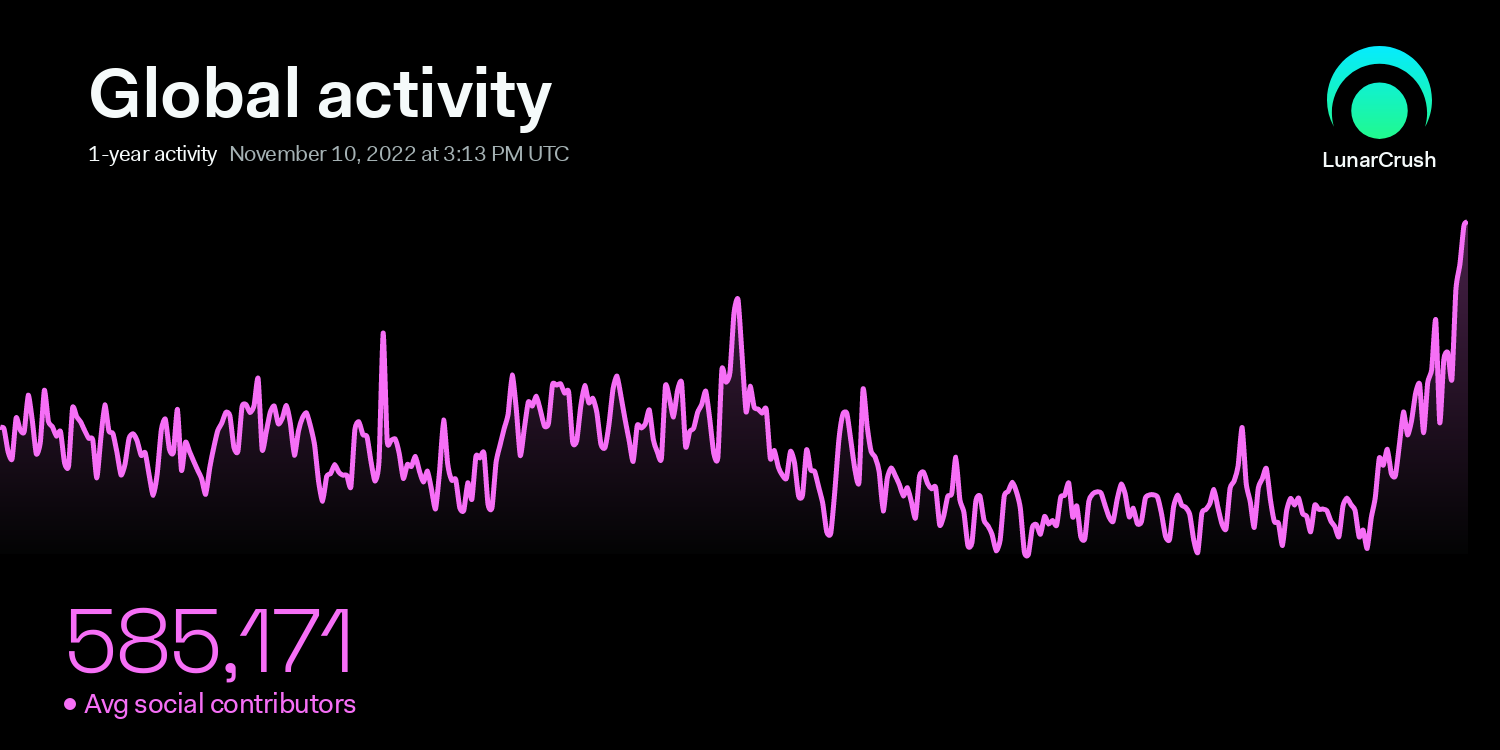
1) Global crypto "social contributors" hit new ATHs
See reference image 1
2) +1 million people talking about crypto - an ATH
See reference image 2
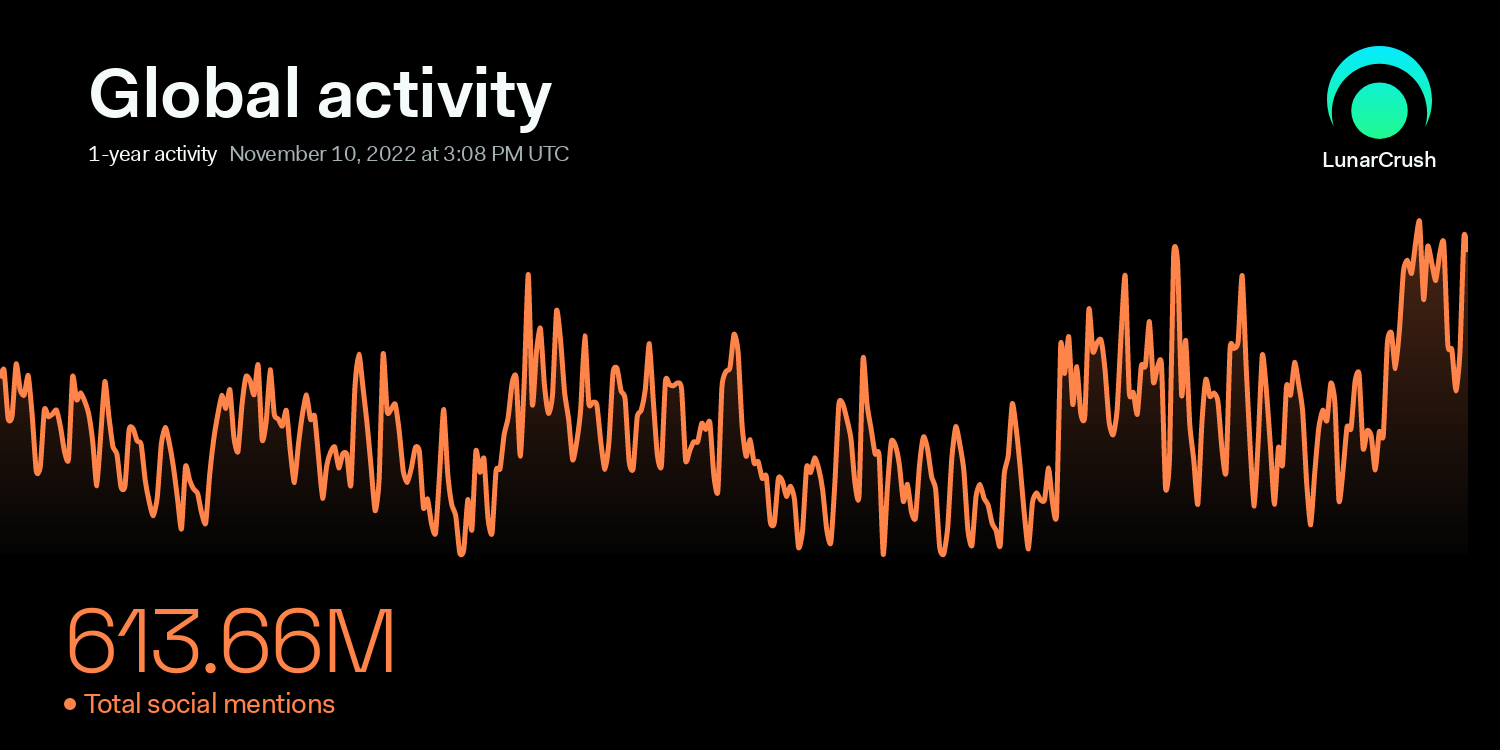
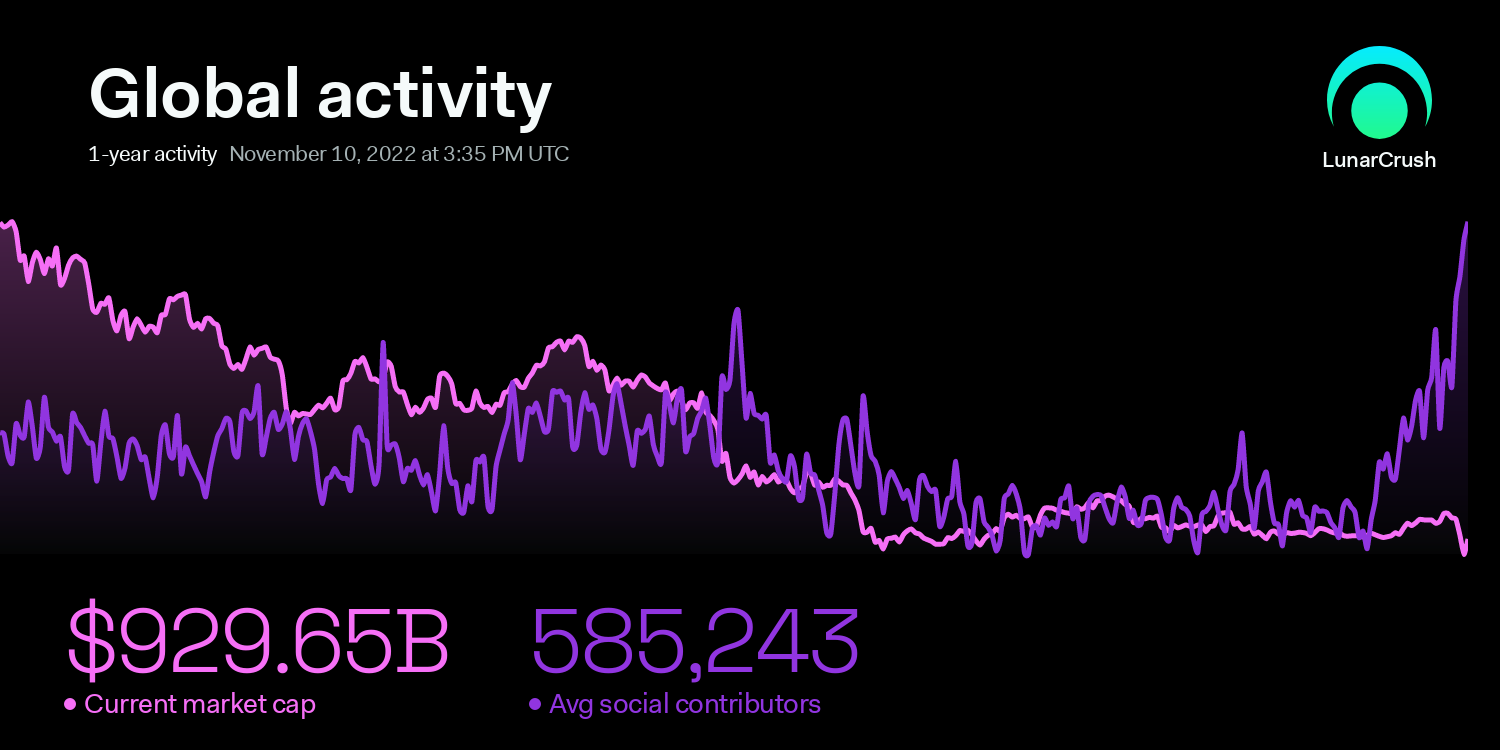
3) Crypto "Social Mentions" on the 1-year time-frame (the bear market)
See reference image 3
1-year global activity:
Current market cap: $929.65B +104.3%
Total social mentions: 613.77M +87.75%
See reference image 4
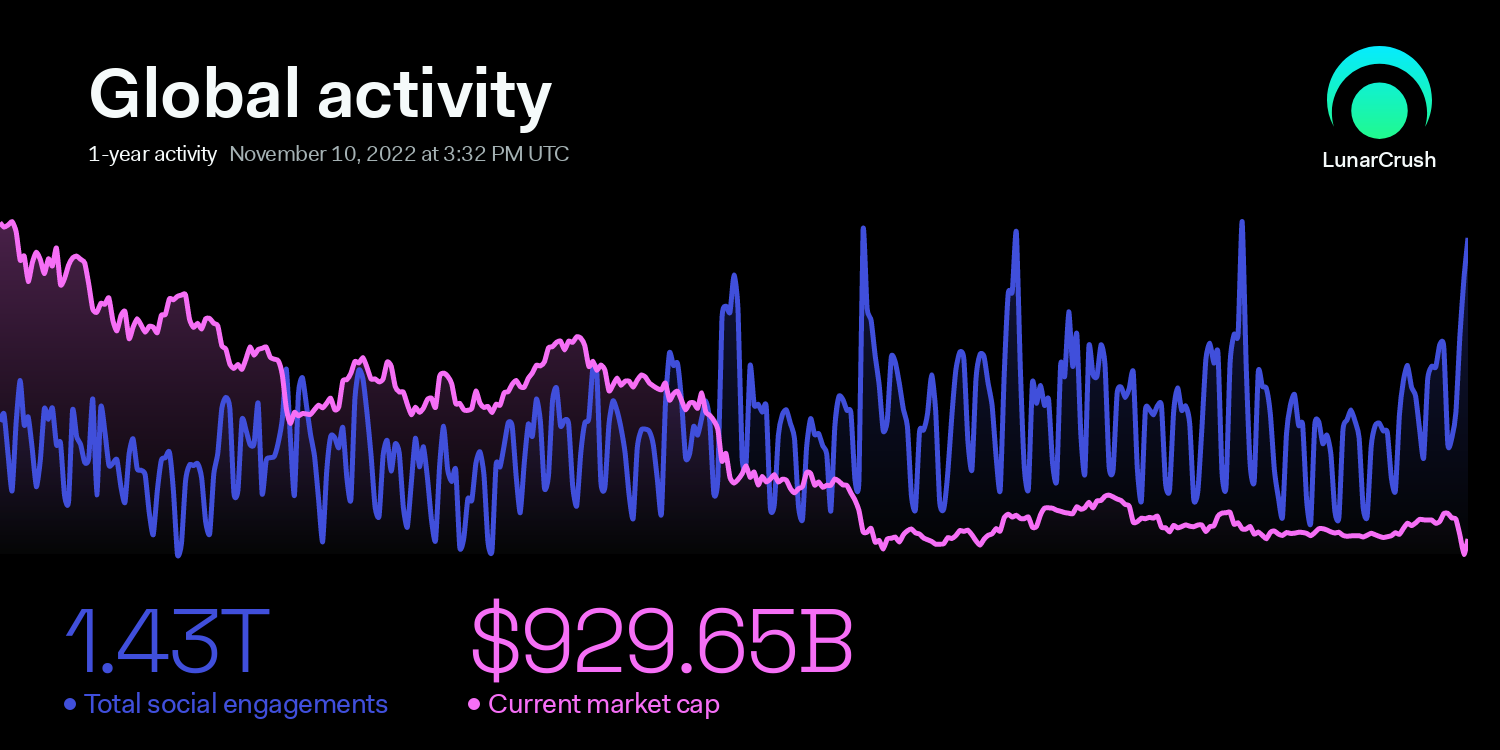
4) Crypto "Social Engagements " on the 1-year time-frame (the bear market)
See reference image 5
1-year global activity:
Total social engagements: 1.43T +64.24%
Current market cap: $929.65B +104.3%
See reference image 6
5) Crypto "Social Contributors" on the 1-year time-frame (the bear market)
See reference image 7
1-year global activity:
Current market cap: $929.65B +104.3%
Avg social contributors: 585.24K +133.8%
See reference image 8
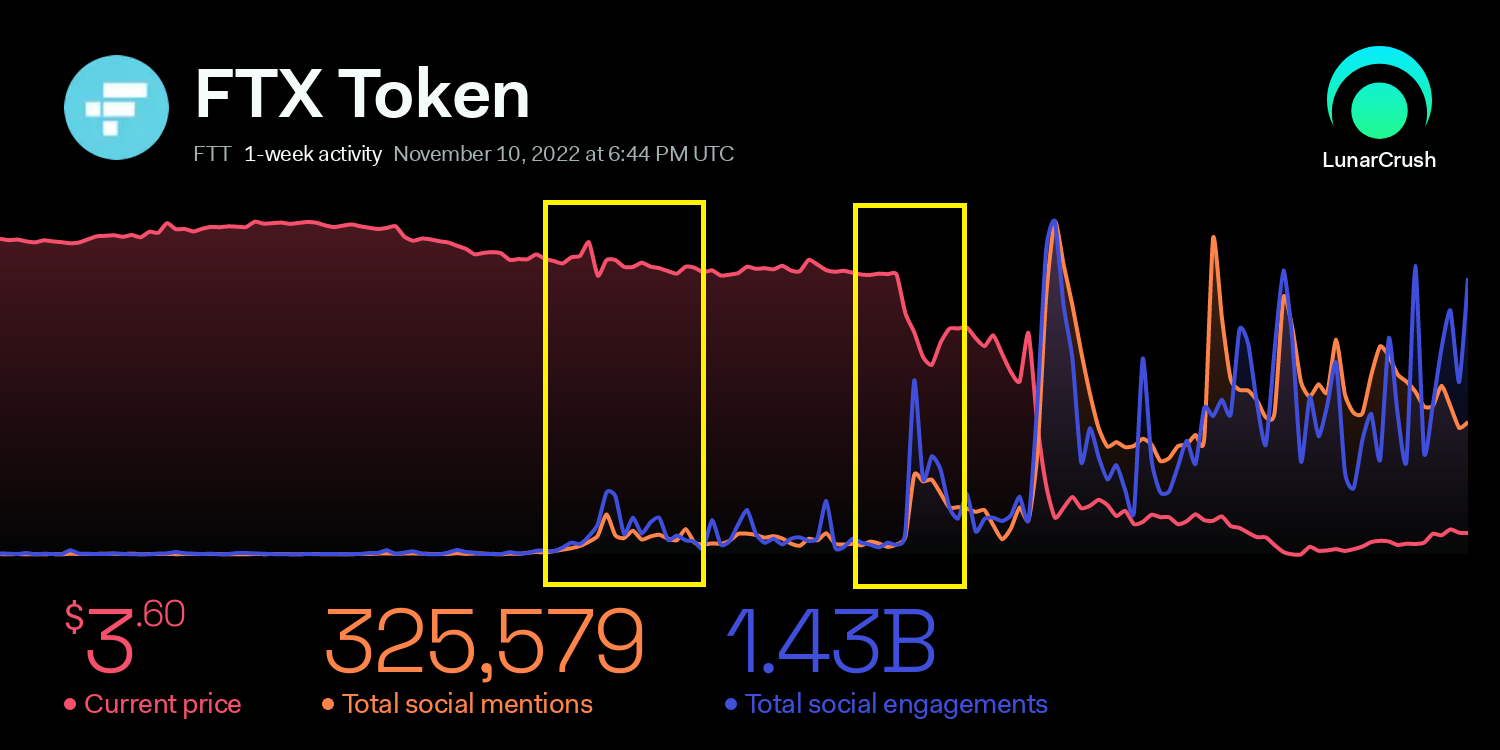
FTX Token $FTT Social Activity
At the beginning of the $FTT collapse - Its social activity was the same as $LUNA at the start of its collapse…
See reference image 9
Large outlier spikes in social activity is like a siren to pay attention. Outlier spikes in social activity can be bullish or bearish, depending on what the social activity is all about.
By going to the "Asset Details" pages on LunarCrush, you can identify every trending post and hit news piece that caused spikes in social activity. You can then get a high-level overview of everything that's happening very quickly so that you can act FAST.
For instance, with the FTX Token ($FTT) example shown above, social activity began to increase rapidly prior to its breakdown below $17. And when you zoom into the 1-week time-frame you'll notice that social activity actually started spiking even earlier, when $FTT was still trading at $23.
Take a look:
See reference image 10
Now, if you scroll down to the bottom of the $FTT "Asset Details" page, you'll see all of the trending posts and hit news pieces that correlate with these spikes in social activity. Upon viewing these trending posts and news pieces, it is evidently clear that this social activity was bearish - providing you with the first warning signs to act on before the $FTT price crashed.
This is how social activity data and insights can be used to take action FAST and make better trading/investing decisions.
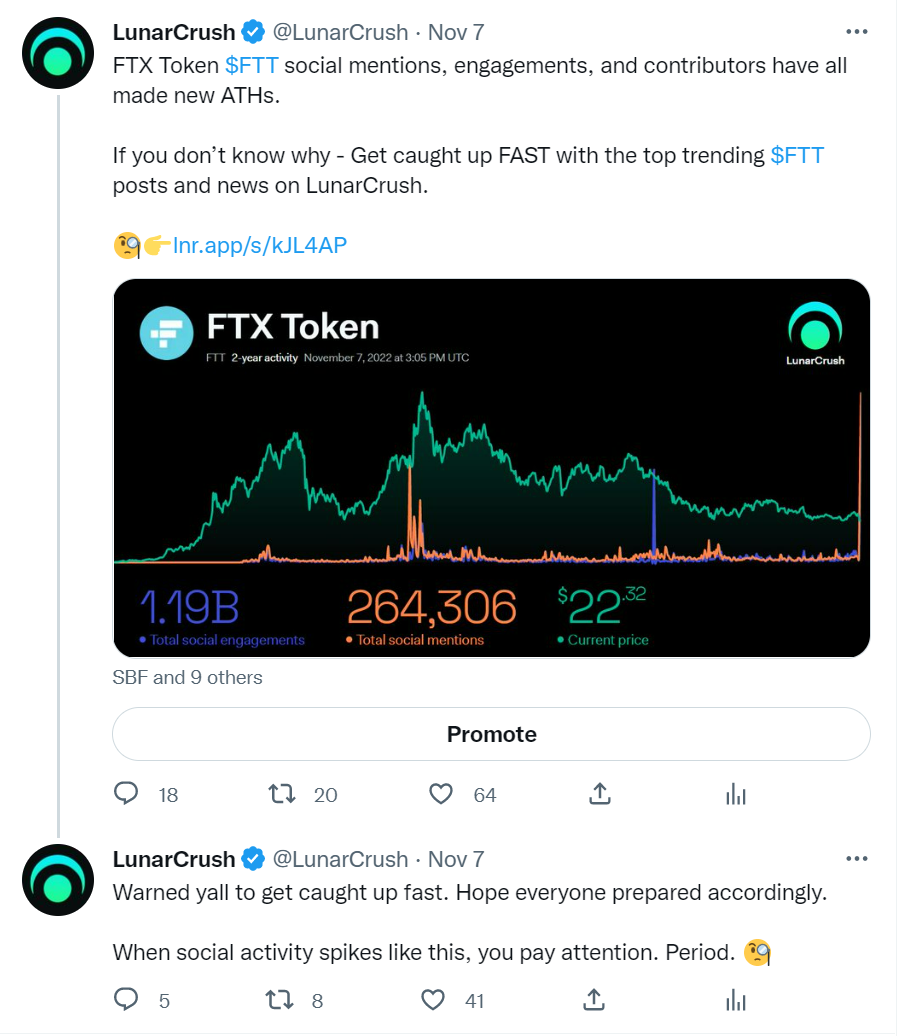
$FTT Social Activity makes new ATHs
See reference image 11
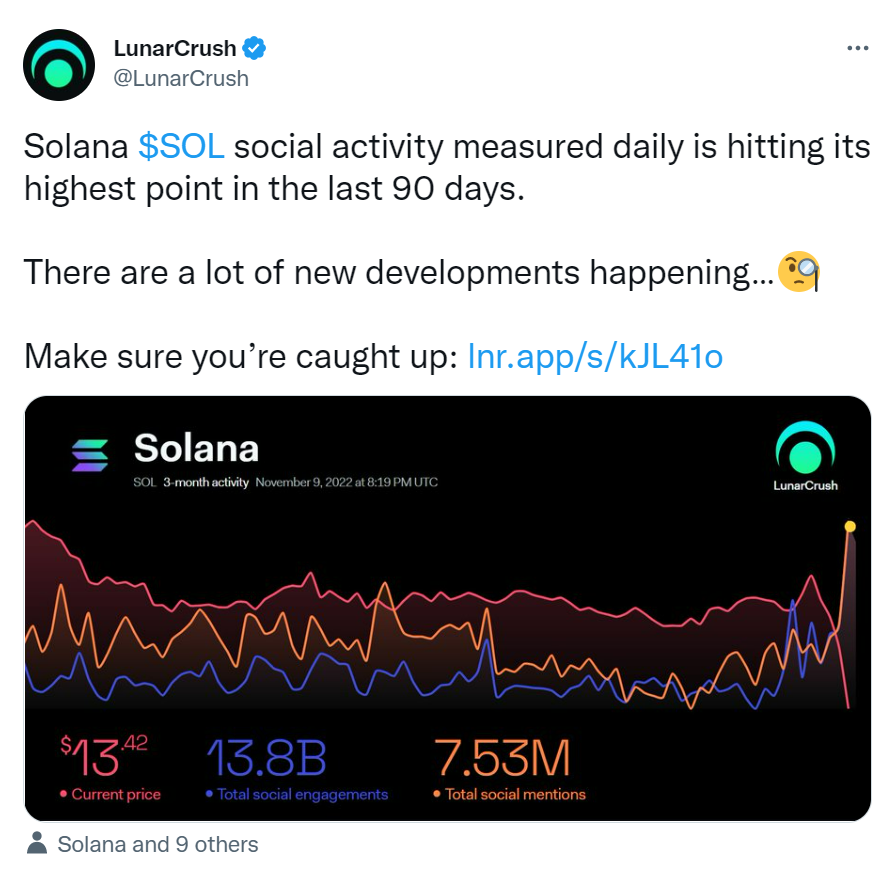
Solana $SOL Social Activity
Outlier Spikes in $SOL social Activity
See reference image 12
LunarCrush collects social and market activity for thousands of cryptocurrencies, NFTs and stocks and transforms it into actionable intelligence. There's more to markets than just trading off of price.
###
If you would like more information about this topic or to speak to Joe or Jon, please contact media relations at [email protected].
Media Contact
Evan Kennedy, LunarCrush, 8053652065, [email protected]
SOURCE LunarCrush


Share this article