The New Value Based Purchasing Dashboard from Health Data Intelligence Helps Hospitals Analyze their VBP Performance and Assess the Financial Impact of their VBP Scores

Columbus, OH (PRWEB) November 12, 2013 -- Health Data Intelligence (HDI) is pleased to announce the introduction of the Value Based Purchasing (VBP) Dashboard and Financial Impact Analyzer into its premier CarePlan Dashboard Suite. The new VBP Dashboard depicts outcomes for each US hospital during the VBP performance period for federal fiscal year of 2013. The VBP program is based on the Affordable Care Act (ACA) and is designed to reimburse hospitals for inpatient acute care services based on the quality of care, rather than on quantity of the services they provide.
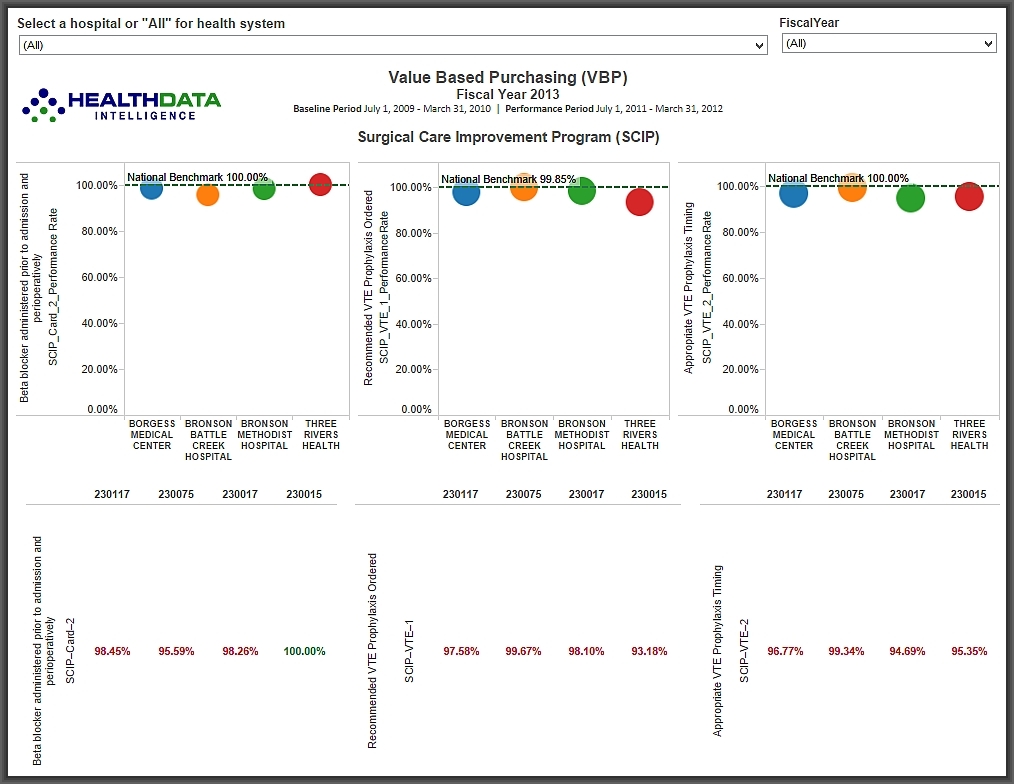
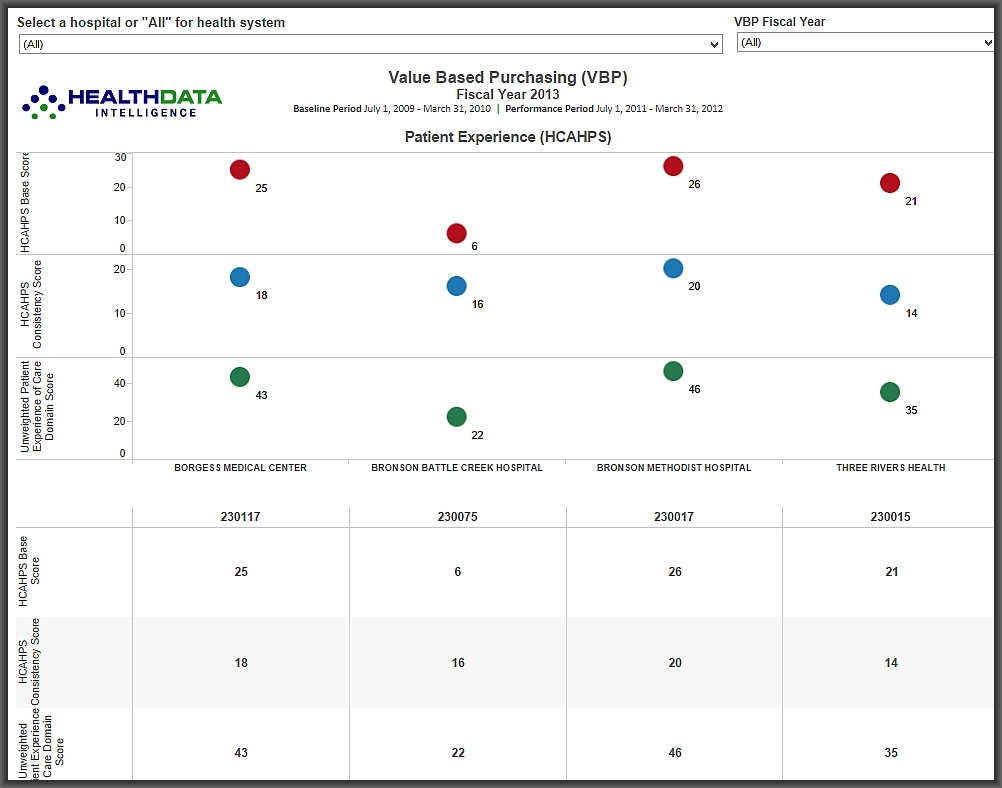
HDI’s Visual VBP Dashboard is a new and innovative way for hospitals to analyze their VBP outcomes. Rather than make users wade through layers of confusing tables, our Visual VBP application presents senior executives, nursing and clinical staff, and those that work in finance etc. with their hospital’s VBP outcomes and performance scores on color-coded, easy to understand graphs, with national benchmarks and thresholds added for comparison purposes. Detailed data remains available for easy access by data analysts and business analysts. Hospitals can request the outcomes of their peers or other competitor hospitals included in their own custom VBP dashboard as an additional benchmarking opportunity.
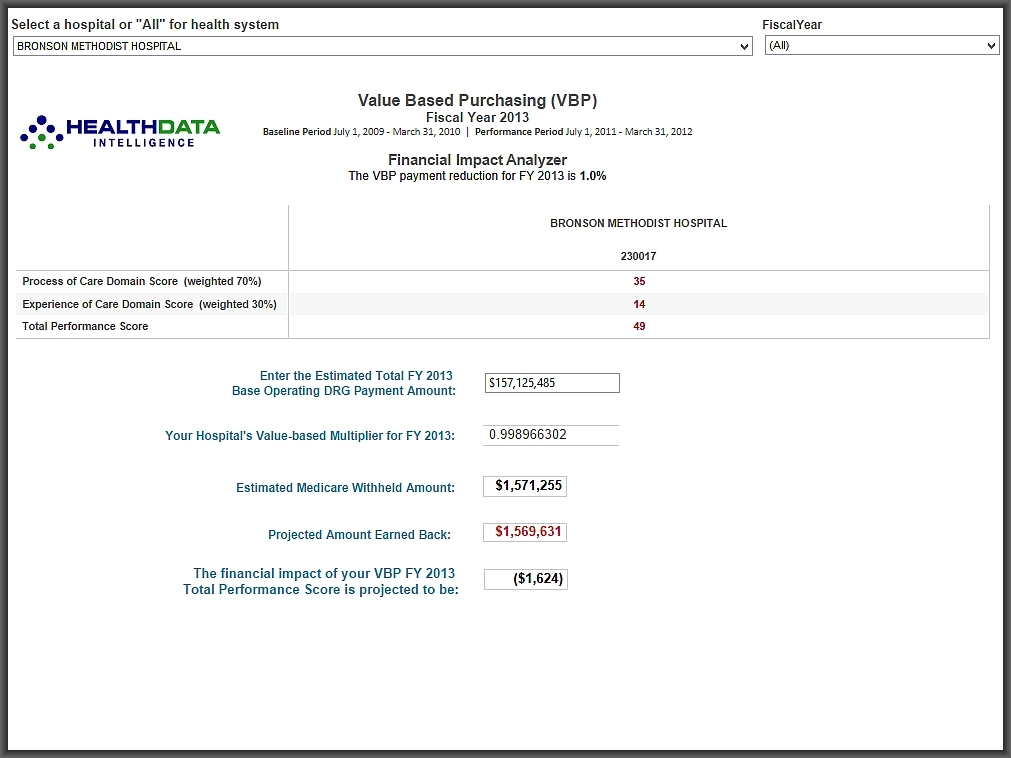
All metrics across the Process of Care and Patient Experience domains are presented in graphical form, and health systems can compare the performance of their system hospitals side by side across all VBP categories of care. An easy to use VBP Financial Impact Analyzer is built into the application, enabling hospitals to estimate on the fly what the financial impact of their VBP Total Performance Scores (TPS) will be on their hospital’s DRG reimbursement for the current federal fiscal year of the VBP program. Our Financial Impact Analyzer relies on the most up-to-date VBP adjustment factors calculated by CMS actuaries for all VBP eligible hospitals for the current fiscal year, ensuring a highly accurate projection.
Navigation within the Visual VBP Dashboard occurs via tabs, with graphical and tabular views for the fiscal year 2013 period, tooltips that provide rich metadata when a user hovers over any data point, filtering capabilities down to the individual hospitals or at the health system level, CMS measure codes to help users uniquely identify each metric, and an About page that provides detailed metric definitions, external links, and other useful information.
Available for benchmarking on the Visual VBP Dashboard are CMS thresholds, benchmarks, and floors for each VBP measure as well as each hospital’s internal targets, organizational performance goals, or outcomes from other hospitals considered rivals or peers. Hospitals, health systems, and media organizations are invited to test drive the new HDI Visual VBP application with a free 7-day preview. To learn more about this new analytic package and to download detailed product data sheets, please visit the Health Data Intelligence corporate website.
Sales and Marketing, Health Data Intelligence, http://healthdataintel.com/, +1 (800) 585-0375, [email protected]
Share this article