SNL Metals Economics Group’s Copper Study Reveals Lower Grades, Higher Costs for Copper Production in 2012

Charlottesville, VA (PRWEB) July 22, 2013 -- SNL Metals Economics Group’s recently released Strategies for Copper Reserves Replacement Study reveals that lower copper grades and higher taxation, royalty, and environmental approval costs are pushing up the copper mining industry’s capital and operating costs.
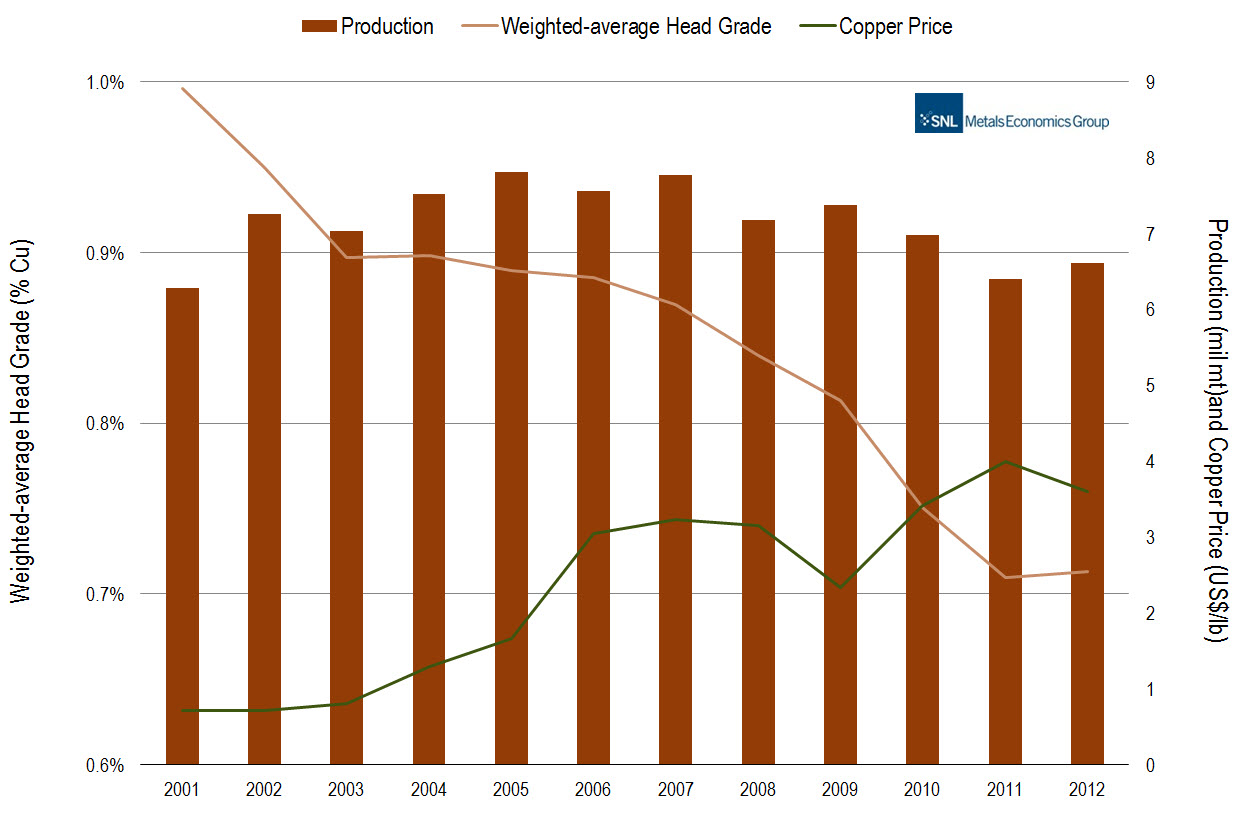
Ore head grades decline over time as companies initially mine high-grade zones to recoup capital costs and other early expenditures. From 2001 to 2012, the weighted-average head grade at 47 producing mines with comparable data declined by almost 30%. Not only are head and reserve grades declining at existing mines, the average ore grades of copper in new discoveries and developing projects also declined over the period. Copper Production, Head Grades, and Price Changes by Year, 2001-12 (47 Mines with 40% of 2012 World Copper Production).
With declining ore grades exacerbated by increasing energy and other costs, and significant deposits being found at greater depths or in more remote areas, the average capital costs for copper production capacity in new mines increased an average of 15% per year over the past 20 years, with much of the increase evident since 2008. Cash operating costs at major mines also increased significantly, more than tripling over the past ten years, to an average of almost $1.50/lb in 2012. Besides the costs of operating mines, companies had to find or purchase reserves to replace mined copper, build mines to replace exhausted ones, continually upgrade equipment, and pay treatment and refining charges. Net of administrative costs, a mining company had an average total cost of about $1.95/lb to replace reserves and produce copper over the period, increasing from about $0.76/lb in 2003 to more than $3.30/lb in 2012.
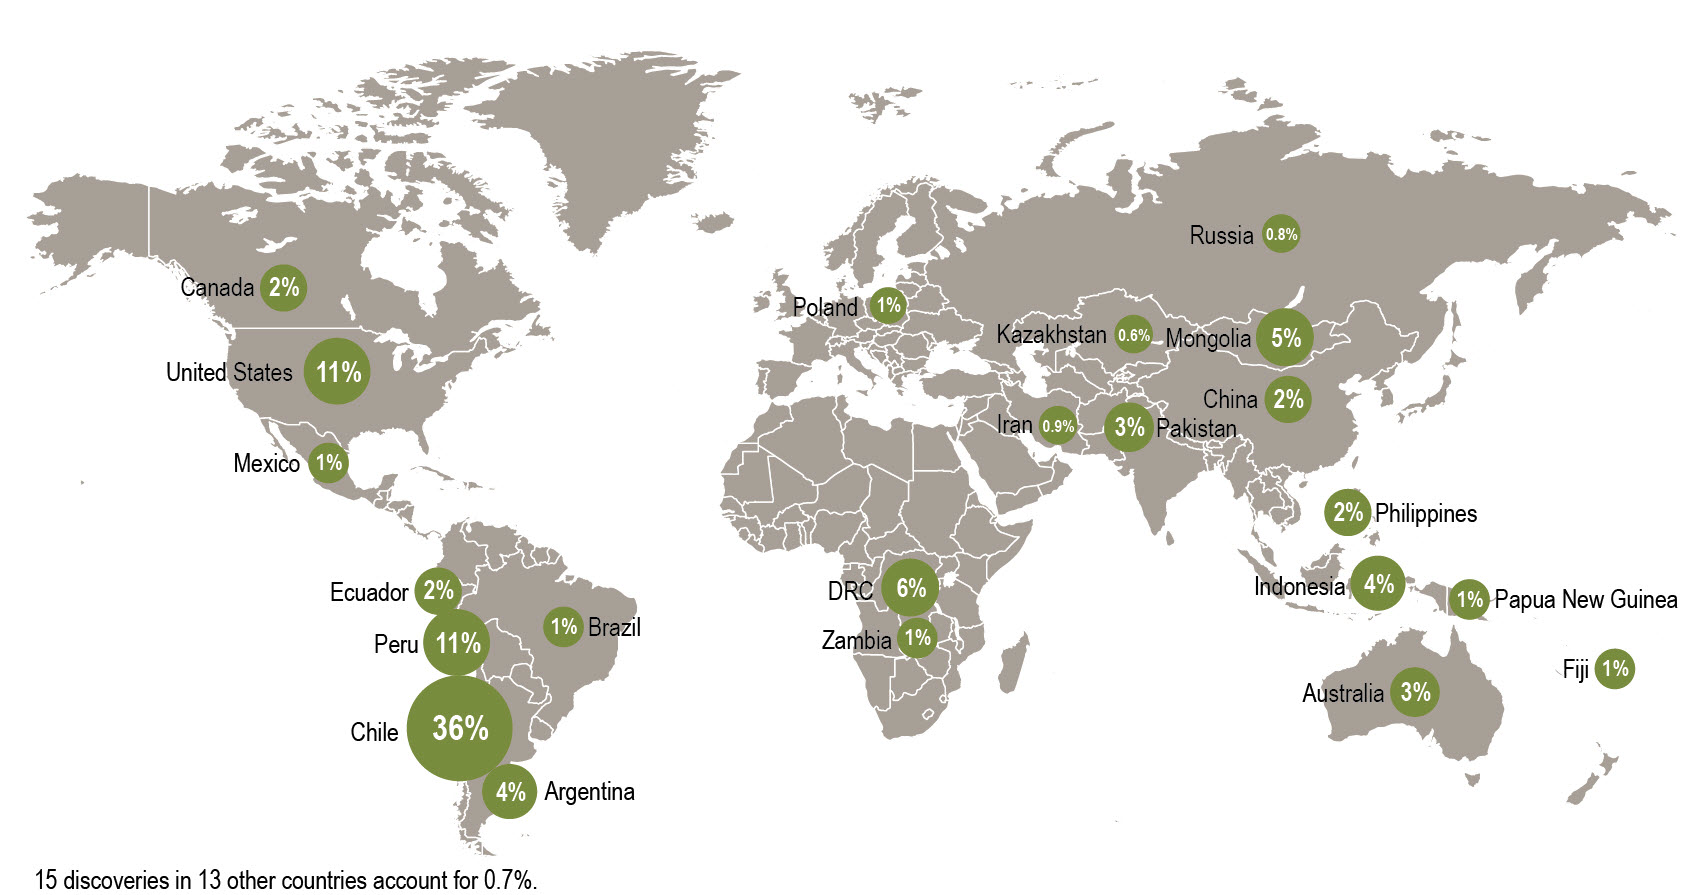
Copper in Major Copper Discoveries by Country, 1998-2012 (Total Reserves, Resources, and Past Production of 395 million mt) Globally, 100 significant copper discoveries (defined as a deposit containing at least 500,000 mt of copper in reserves, resources, and past production) have been reported so far in the 1998-2012 period, containing almost 395 million mt of copper. Benefiting from the largest share of discovery-oriented exploration budgets over the period, Latin America hosts more than half of the discovered copper, followed distantly by North America, Africa, Asia, Australia-Pacific, and Europe.
Overall, the industry found more copper in these significant discoveries than it produced; however, the economic viability of new resources is influenced by factors such as location and politics, capital and operating costs, and market conditions that inevitably reduce the amount of copper that reaches production. To date, only about one-tenth of the copper in these 100 discoveries has been converted to reserves with only 15 deposits having reached production.
Meanwhile, the 22 major copper producers (those that mined at least 140,000 mt of copper in 2012) replaced almost 300% of their copper production over the past ten years. These producers also increased their aggregate annual production by 39% to 11.2 million mt in 2012, and held sufficient reserves for 36 years of production at 2012 rates. The majors’ increased production exacerbates their need to add reserves to maintain a steady production pipeline, however, and based on 2012 production these producers need to replace an average of at least 500,000 mt of copper reserves each year, ranging from a high 1.8 million mt for Codelco to less than 142,000 mt for Vedanta Resources.
SNL Metals Economics Group’s Copper Reserves Replacement Strategies study addresses key growth strategy issues facing the copper mining industry and compares the relative costs per pound of discovering or acquiring copper in the ground. The study provides an industry-wide review of the copper pipeline, acquisition activity, copper exploration budgets, and major discovery successes, and a variety of metrics for measuring and comparing the relative costs of various growth strategies for the 22 largest copper miners and the industry as a whole. In addition, the study looks in detail at key industry indicators, such as the increasing time from discovery to production, the continuing decline in head grades and reserves grades, and the ongoing trend of rising capital and operating costs.
Christina Twomey, SNL Financial, 434-951-6914, [email protected]
Share this article