
New product gives any short-term rental investor granular, neighborhood-level performance data — alongside market-wide analytics, custom comp sets, amenity ROI analysis, and operator-level visibility — using the largest available STR dataset to date.
NEW YORK, June 3, 2026 /PRNewswire-PRWeb/ -- BNBCalc Launches "Markets," Exposing Airbnb and VRBO Earnings of More Than 20 Million Homes
New product gives any short-term rental investor granular, neighborhood-level performance data — alongside market-wide analytics, custom comp sets, amenity ROI analysis, and operator-level visibility — using the largest available STR dataset to date.
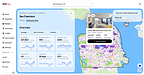
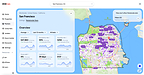
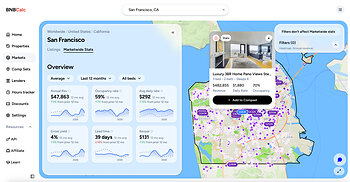
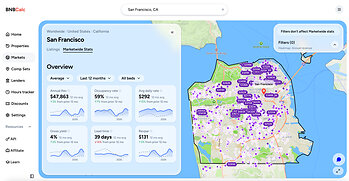
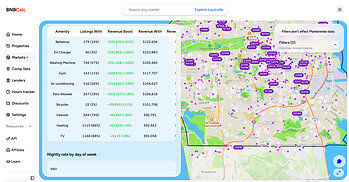
BNBCalc, the short-term a rental analytics platform used by more than 230,000 investors, Property Managers and Real Estate Brokers, today launched BNBCalc Markets, a research product that exposes Airbnb and VRBO performance data — including revenue, occupancy, and nightly rates — for more than 1 million individual homes across the United States and over 20 million homes globally. For the first time, any investor can see how every Airbnb on a given street, in a given neighborhood, or across a given metro is actually performing — at both the 30,000-foot view and the single-property level — for $80 per month or $399 per year.
Earnings That Have Been a Black Box — Until Now
For most real estate investors, finding out what an Airbnb a few doors down actually earns has been nearly impossible. Performance data has lived inside private datasets, behind enterprise contracts, or scattered across listing scrapes that take days to assemble. Markets makes that data legible at consumer scale.
The platform indexes more than 1 million homes across Airbnb and VRBO, allowing users to:
- See every Airbnb and VRBO in any U.S. market on a single map, filterable by revenue, occupancy, gross yield (cash-on-cash return), nightly rate, bedroom count, and operator type (individual host or property management company).
- Build custom comp sets — investors define their own benchmark group of properties instead of relying on software-generated averages.
- Quantify the ROI of specific amenities — Markets identifies which amenities (hot tubs, pools, pickleball courts, EV chargers, game rooms, and more) drive the largest revenue lift in each market, turning amenity decisions from gut calls into hard ROI math.
- Pull market-wide analytics benchmarked against national averages — average daily rate, occupancy, annual revenue, and seasonality for every U.S. market, side by side with the national baseline.
- Identify the operators behind every listing — see which property managers and individual hosts run which homes, and how each operator's portfolio is performing in real time.
From a 30,000-Foot View to a Single Block
The product is designed for the way investors actually make decisions — top-down and then street-by-street.
An investor evaluating where to buy can rank every metro in the country by ROI, drill into specific neighborhoods within a chosen market, and zoom all the way down to compare two or three homes on the same block. Markets surfaces revenue and occupancy data for each individual property, not just neighborhood averages, so investors can underwrite a deal against the actual nearby homes they would compete with — not a modeled estimate.
That granularity is what has historically separated institutional STR buyers from individual investors. Markets closes the gap.
"For years, the actual earnings of every Airbnb on your street have been a black box," said Parker Place, founder and CEO of BNBCalc. "An investor putting six figures into a property could see what the house down the road sold for, but had no idea whether it was making $40,000 a year or $140,000. Markets opens that box. You can finally see exactly which homes in your target neighborhood are making money — how much — and which aren't — before you make an offer."
Built for Investors and Operators Both
Markets is built around the two questions every serious STR investor and operator asks. First — Where should I buy? Investors can rank metros nationwide by ROI, drill into the highest-yielding neighborhoods within a market, and stress-test investment assumptions against live performance data from real listings.
Second — Who's winning, and what are they doing differently? Once an investor or property manager owns in a market, Markets functions as a competitive intelligence platform. Users can identify the top-performing operators on the map, study their amenity mix and pricing strategy, spot underperforming property managers whose contracts may be in play, and track how revenue moves from one operator to another. It is the first STR research product designed to be used as both a buy-side and a sell-side tool by the same investor.
Pricing and Availability
BNBCalc Markets is available now at BNBCalc.com/markets.
- Markets: $80/month or $399/year (annual save: ~64%)
- Calculator: $30/month or $200/year (unchanged)
Early Customer Reaction
"Being able to isolate top-earning operators within a given market is a game-changer. I can see what they are doing to differentiate their properties so I can replicate their success and do it better. BNBCalc's Market tool is sure to give me the upperhand in competitive markets." — Patryk Swietek, Owner | The Cohost Company
About BNBCalc
BNBCalc is a short-term rental analytics platform used by investors, realtors, and property managers to make data-driven investment decisions across the United States. The company's products combine property-level revenue projections with market-level intelligence and real-time pricing data, helping users find high-ROI deals faster. Founded by Parker Place and Jeremy Werden, BNBCalc has grown to become a rental data juggernaut one of the leading companies within the industry.
Media Contact
Robert Gilliam, BNBCalc, 1 3364205540, [email protected], https://www.bnbcalc.com
SOURCE BNBCalc


Share this article