InfoCaptor Simplifies Big Data Analytics with New Connection Support for Cloudera Enterprise

Pittsburgh, PA (PRWEB) August 11, 2015 -- Rudrasoft, the software company that specializes in data analytics dashboard solutions, announced today that it has released an updated version of its popular InfoCaptor software, which includes integration with Cloudera Enterprise. The integration takes advantage of Impala and Apache Hive for analytics.
"Our clients are increasingly looking to adopt Hadoop for their data storage and analytics requirements and their common concern is the lack of an economical web-based platform that works with their traditional data warehouses, RDBMS and with Cloudera Enterprise," said Jay Nesh, Engineer/Data Analyst at Rudrasoft. "With the new release, we have bridged the gap of providing Data Discovery on Cloudera along with traditional data sources".
Cloudera-certified InfoCaptor, adds native Impala functionality within Visualizer so users can leverage Date/time functions for date hierarchy visualizations, time series plots and leverage all the advanced hierarchical visualization natively on Cloudera Enterprise.
"Impala is the fastest SQL engine on Hadoop and InfoCaptor can render millions of data points into beautiful visualizations in just a blink of an eye," said Nilesh Jethwa [founder]. "This is a great promise for the big data world and affordable analytics with sub-second response time, finally CEOs and CIOs across industries can truly dream of cultivating a data driven culture and make it a reality."
"Cloudera welcomes InfoCaptor as a certified partner for data analytics and visualization. InfoCaptor delivers self-service BI and analytics to data analysts and business users in enterprise organizations, enabling more users to mine and search for data that uncovers valuable business insights and maximizes value from an enterprise data hub," said Tim Stevens, vice president of Business and Corporate Development at Cloudera.
InfoCaptor is an Enterprise Business Analytics and Dashboard software meant for:
- Data Discovery
- Visualizations
- Adhoc Reports
- Dashboards
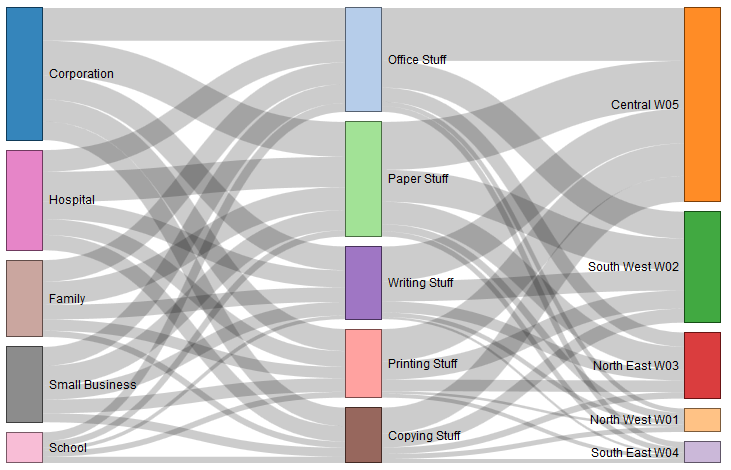
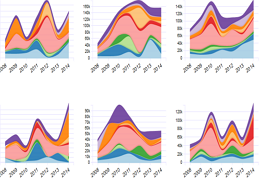
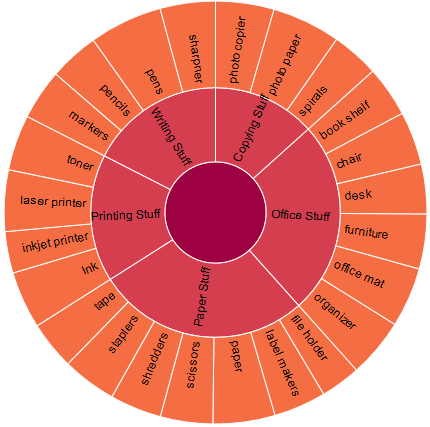
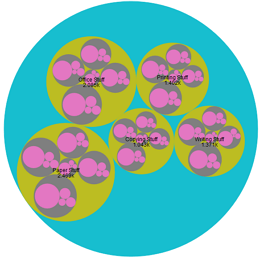
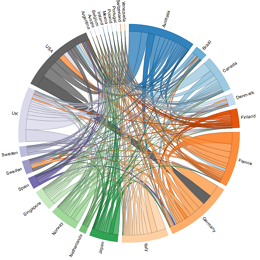
InfoCaptor brings the power of d3js.org visualizations and the simplicity of Microsoft Excel and puts it in the hands of a non-technical user. This same user can build Circle Pack, Chord, Cluster and Treemap/Sunburst visualizations on top of Cloudera Enterprise using simple drag and drop operations.
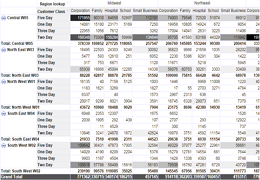
InfoCaptor can connect with data from virtually any source in the world, including SQL database from Microsoft Excel, Microsoft Access, Oracle, SQL Server, MySQL, Sqlite, PostgreSQL, IBM DB2 and now Impala and Hive. It supports both JDBC and ODBC protocols.
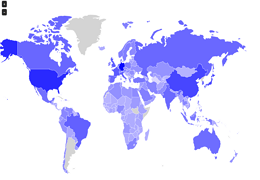
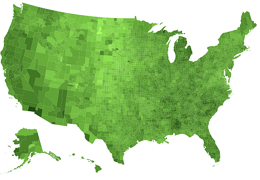
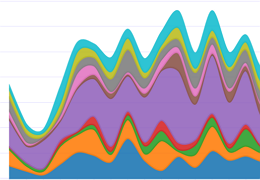
InfoCaptor also serves as a powerful visualization software and it includes over 30 vector-based map Visualizations, close to 40 types of chart visualizations, over 100 flowchart icons and other HTML widgets. InfoCaptor also provides a free style dashboard editor that allows quick dashboard mockups and prototyping. With this ability users can place widgets directly anywhere on the page and use flowchart style icons and connectors for annotation and storytelling.
Users can download the application and install it within their firewall.
Alternatively, a cloud offering is also available at https://my.infocaptor.com or Download dashboard software
InfoCaptor is a very modestly priced Analytics and Visualization software
- Personal Dashboard License can be purchased for $149/year
- Server license starts at $599/year
- Cloud based subscription starts at $29/user/month
Visit http://www.infocaptor.com or email bigdata(at)infocaptor(dot)com for Demo and Price list
Brinda J, [email protected], https://my.infocaptor.com, +1 (412) 532-6273, [email protected]
Share this article