
Pending New Home Sales Have Increased Year-Over-Year in all 25 Select Markets Tracked by Zonda
NEWPORT BEACH, Calif., July 21, 2023 /PRNewswire-PRWeb/ -- Today, the experts at Zonda, the housing industry's foremost advisors, released the New Home Market Update report for June 2023.
Today's housing market is unique. The Federal Reserve has raised short-term interest rates ten times since March of last year with the intention of slowing the overheated economy. One of the sectors that is traditionally most sensitive to higher rates is the housing market. We saw the pullback last year as a result.
There has been an unintended consequence of the higher rates, though. The demand pool is down notably, but the supply pool is down even more. Those that already own a home are reluctant to give up their historically low interest rate and buy again at the high-6%s and low-7%s. As a result, available housing inventory is a hot commodity.
"While consumers have brushed off higher interest rates, we are tracking the impact of tighter credit conditions on acquisition, development, and construction loans, especially for smaller builders," said Ali Wolf, Zonda's chief economist. "There is an increased desire to get more homes built but there are also factors outside of our control that could play a huge role in where the market goes from here."
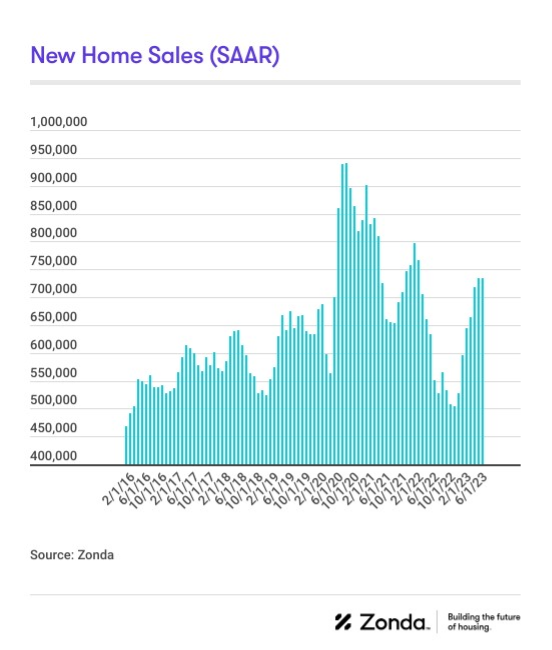
June sales posted strong numbers on a seasonally-adjusted basis
Zonda's new home sales metric counts the number of new home contract sales each month and accounts for both cancellations and seasonality. This metric shows there were 734,242 new homes sold in June on a seasonally adjusted annualized rate. June's number was essentially flat month-over-month but up 33.5% from a year ago. On a non-seasonally adjusted basis, 62,558 homes were sold, 36.1% higher than last year and 11.9% above the same month in 2019.
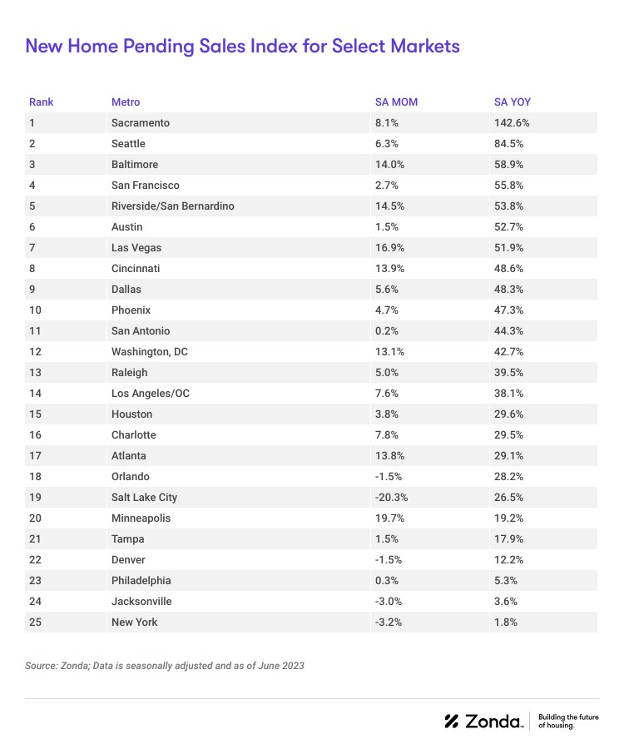
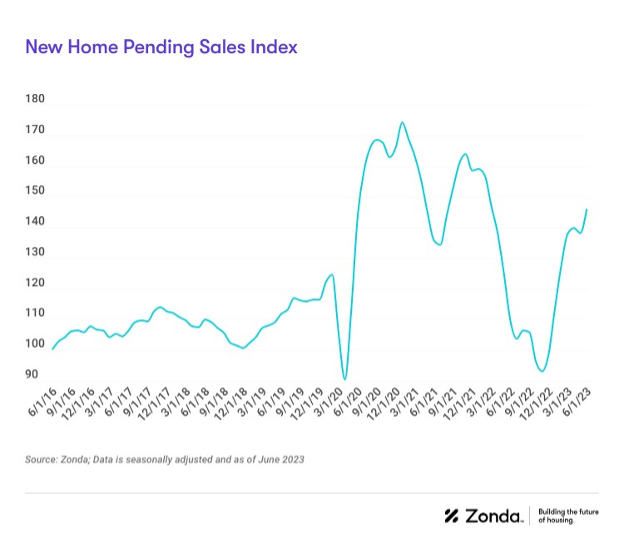
Supply-adjusted sales show strong gains from weak 2022
Total sales volume is influenced by both supply and demand. Zonda's New Home Pending Sales Index (PSI) was created to help account for fluctuations in supply by combining both total sales volume with the average sales rate per month per community. The June PSI came in at 146.0, representing a 33.3% rise from the same month last year. The index is currently 16.1% below cycle highs. On a month-over-month basis, seasonally adjusted new home sales increased 5.7% despite a slight unadjusted decline.
- • The markets that posted the best numbers relative to last year were Sacramento (+142.6%), Seattle (+84.5%), and Baltimore (+58.9%). These markets faced some of the most pronounced slowdowns last year and have since stabilized. The base effect of last year's low levels is driving the large increases.
- • The metros that performed the worst year-over-year were New York (+1.8%), Jacksonville (+3.6%), and Philadelphia (+5.3%). Notice that these markets are positive. Every one of our select markets posted a year-over-year gain in June.
- • On a monthly basis, Minneapolis, Las Vegas, and Riverside/San Bernardino were the best-performing markets.
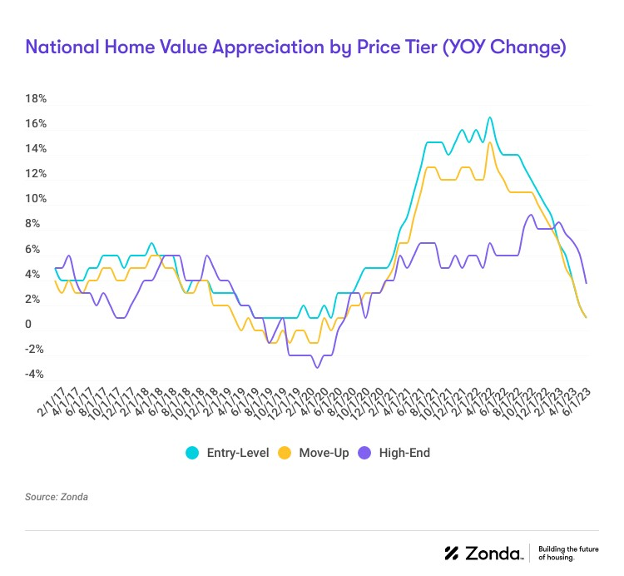
Sales are up but pricing is more stable
National home prices increased year-over-year across entry-level, move-up, and high-end homes. Prices rose 1.1% for entry-level to $338,748, 1.0% for move-up to $526,697, and 3.7% for high-end homes to $913,624.
Supplementing our data with a monthly survey Zonda conducts, 53% of builders reported raising prices in June and 42% reported holding prices flat. This stands in direct contrast to the end of last year where roughly 50% of builders were lowering prices and 50% were holding prices flat.
Incentives are still common in today's housing market to help address the affordability constraints for buyers. 63% of new home communities across the country were offering incentives in June, with the most popular incentives being mortgage rate buydowns, funds towards closing costs, and flex dollars.
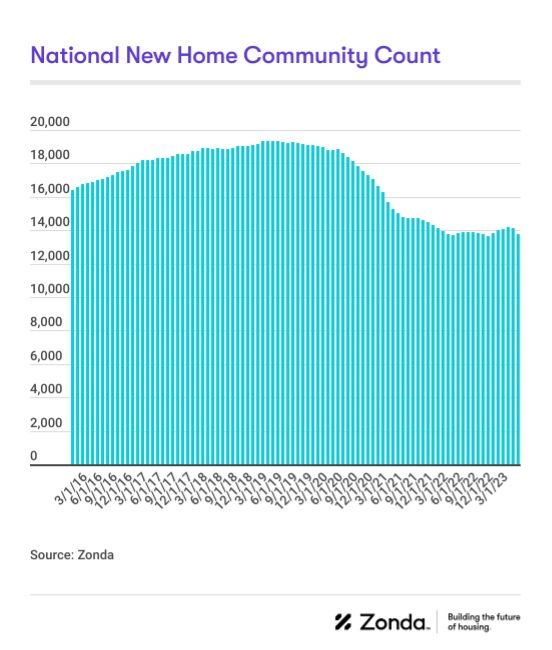
New home communities still selling out quicker than they can be replaced
There are currently 13,791 actively selling communities tracked by Zonda, down 0.2% from last year. On a month-over-month basis, the national figure slipped 2.2%. Total community count is 28.7% below the same month in 2019. The lack of competition from other new home communities is allowing for some upward pressure on the average sales rate per month per community. Zonda defines a community as anywhere where five or more units are for sale.
- • Riverside/San Bernardino (+15.4%), Austin (+11.0%), and Salt Lake City (+8.9%) grew community count the most year-over-year. Community count is down 8.1%, 19.7%, and 30.3%, respectively, compared to 2019.
- • Community count fell the most in Tampa (-15.5%), San Francisco (-12.9%), and Atlanta (-10.6%) relative to last year.
- • Community count in just 4% of our select markets rose month-over-month while 96% fell.
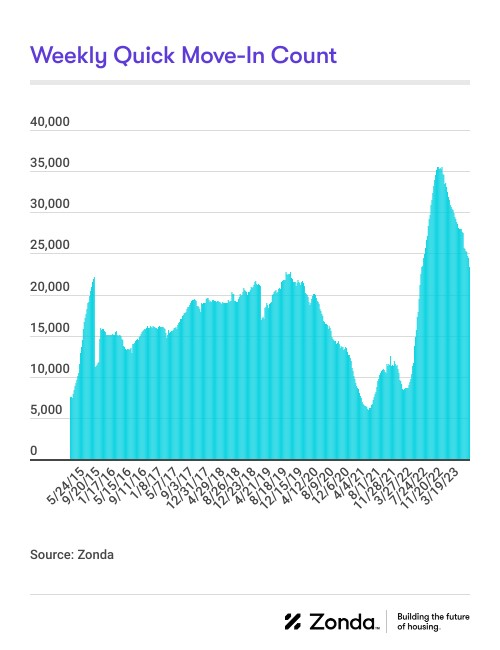
National quick move-ins (QMIs) totaled 23,333, up 3.6% compared to last year but 8.7% lower month-over-month. Total QMIs are 42.2% above 2019 levels. QMIs are homes that can likely be occupied within 90 days.
QMIs are selling out quicker than they can be replaced in many markets as consumers view these homes as a great alternative to the resale market given the dearth of supply.
- • On a metro basis, 40% of Zonda's select markets increased QMI count year-over-year.
- • The markets that grew the most year-over-year were Salt Lake City (+154.3%), Phoenix (+37.4%), and Cincinnati (+30.4%).
- • Jacksonville, Las Vegas, and Sacramento have seen the most growth in QMIs compared to the same time in 2019, up 378.3%, 184.9%, and 115.8%, respectively.
- • QMIs are down the most compared to 2019 in Seattle (-64%), Atlanta (-63%), and Baltimore (-59%).
Methodology
The Zonda New Home Pending Sales Index (PSI) is built on proprietary, industry-leading data that covers 60% of the production new home market across the United States. Reported number of new home pending contracts are gathered and analyzed each month. Released on the 15th business day of each month, the New Home PSI is a leading indicator of housing demand compared to closings because it is based on the number of signed contracts at a new home community. Zonda monitors 18,000 active communities in the country and the homes tracked can be in any stage of construction.
The new home market represents roughly 10% of all transactions, allowing little movements in supply to cause outsized swings in market activity. As a result, the New Home PSI blends the cumulative sales of activity recently sold out projects with the average sales rate per community, which adjusts for fluctuations in supply. Furthermore, the New Home PSI is seasonally adjusted based on each market's specific seasonality, removes outliers, and uses June 2016 as the base month. The foundation of the index is a monthly survey conducted by Zonda. It is necessary to monitor both new and existing home sales to establish an accurate picture of the relative health of the residential real estate market.
Visit ZondaHome.com or follow us on LinkedIn and Facebook for more information.
About Zonda
Zonda provides data-driven housing market solutions to the homebuilding industry. From builders to building product manufacturers, mortgage clients, and multifamily executives, we work hand-in-hand with our customers to streamline access to housing data to empower smarter decisions. As a leading brand in residential construction, our mission is to advance the home building industry, because we believe better homes mean better lives and stronger communities. Together, we are building the future of housing.
Media Contact
Valerie Sheets, Zonda, 949-294-9557, vsheets@zondahome.com
SOURCE Zonda

Share this article