
StreetLight Data analysis of 5 years of data shows an overall rebound in driving and congestion beyond 2019 levels in nearly every metro.
SAN FRANCISCO, Sept. 12, 2024 /PRNewswire-PRWeb/ -- StreetLight Data, Inc. (StreetLight), a subsidiary of Jacobs (NYSE: J) and the leading Big Data company providing insights into how people, goods, and services move, today released The State of VMT and Congestion: Measuring 5 Years of Vehicle Miles Traveled (VMT) ebook. This expansive report looks at mobility data from January 2019-May 2024, and in addition to several other findings, the report ranks VMT and congestion for the country's 100 most populous metro areas.
Until the pandemic, VMT across the U.S. was on a largely unbroken trajectory upwards. While stay-at-home orders resulted in an abrupt and dramatic decline in VMT beginning in 2020, as the pandemic receded and the economy bounced back, changes in work culture raised a new and exciting question: Could the U.S. keep VMT down? The data now shows that the overarching answer is no--VMT has generally sped past even 2019 levels. StreetLight's The State of VMT and Congestion report explores the discrete results by looking at four major metrics over a five-year period, Change in VMT, VMT Per Capita, Change in Congestion, and Overall Congestion. The report also looks at the correlation between VMT and congestion in the biggest cities.
"By utilizing the StreetLight Insight® platform and big data analytics, StreetLight has for the first time produced a data-driven report that uncovers how Americans' driving has, and has not, changed over a five-year period that saw massive swings in our driving habits," said Laura Schewel, StreetLight CEO and VP of Transportation Software at Jacobs. "While some metros, particularly in California, kept their VMT below 2019 levels, the reality is despite pandemic lows and changes in work, much of the country has returned to and past pre-pandemic levels of VMT and congestion. Controlling and reducing VMT is necessary if we want to meet our transportation climate emissions reduction targets. These data give us an opportunity to explore how VMT has evolved in different contexts, which we hope can lead to wiser decisions about adjusting this upward trend in the future."
Key Findings from The State of VMT and Congestion report include:
National
- Nationally, VMT per capita was up 12% in May 2024, compared to May 2019.
- January through May 2024 saw a bigger increase in VMT compared to the same period in 2023 than any year since the initial pandemic bounce back.
Top 25 Metros
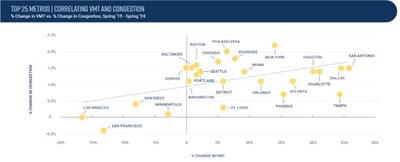
- Among the 25 most populated metros, the correlation between VMT and congestion is pronounced. Five see VMT still below spring 2019 levels. Just one, San Franscisco, sees congestion modestly below 2019.
- Downtowns in the top 25 metros also saw a correlation between VMT and congestion. VMT is down in 18 of these urban cores compared to 2019, but congestion is only down in eight of them.
- New York City, where congestion pricing was paused, stands out as the urban core with the biggest increase in both congestion and VMT among the top 25.
Top 100 Metros
- 88 of the top 100 metros in the U.S. saw VMT increase from spring 2019 through spring 2024. Only four metros saw decreases in the double digits.
- Congestion is up in nearly every metro. Only six of the top 100 metros kept congestion at or below 2019 levels.
- California saw a concentration of metros that have kept VMT below 2019 levels. The only other large metro that hasn't seen VMT rise since 2019 is Washington D.C.
To get a copy, see the various metro breakouts, and read StreetLight Data's The State of VMT and Congestion: Measuring 5 Years of Vehicle Miles Traveled (VMT) ebook, visit streetlightdata.com/vmt-report.
Methodology
The State of VMT and Congestion: Measuring 5 Years of Vehicle Miles Traveled (VMT) analysis includes all vehicle segment-level travel within the geographic zone on segments that are at least 50 meters, including all residential roadways and excluding service roads. National data includes VMT in all CBSAs across the continental U.S., covering nearly all of the populated lower 48. The top 100 metros are identified based on population size and include the full CBSA, used interchangeably with the term "metro. To measure downtowns, StreetLight analyzed census tracts labeled as "urban core" based on the density of their roadway networks. Congestion factor is measured as one minus the average observed speed over the free flow speed. StreetLight normalizes for population based on the 2020 Census.
About StreetLight, a Jacobs Company
StreetLight Data, Inc. ("StreetLight") pioneered the use of Big Data analytics to shed light on how people, goods, and services move, empowering smarter, data-driven transportation decisions. The company applies proprietary machine-learning algorithms and its vast data processing resources to measure travel patterns of vehicles, bicycles and pedestrians, accessible as analytics on the StreetLight InSight® SaaS platform. Acquired by Jacobs as a wholly owned subsidiary in February 2022, StreetLight provides innovative digital solutions to help communities reduce congestion, improve safe and equitable transportation, and maximize the positive impact of infrastructure investment.
Media Contact
Peter Evers, StreetLight Data, 1 (415) 888-3680, [email protected], www.streetlightdata.com
SOURCE StreetLight Data

Share this article