
Slower Housing Demand Coincides with a 173.5% Year-Over-Year Increase in Quick Move-In Inventory
NEWPORT BEACH, Calif., Dec. 21, 2022 /PRNewswire-PRWeb/ -- Today, the experts at Zonda, the housing industry's foremost advisors, released the New Home Market Update report for November 2022.
The choppiness in the new home market remains as seasonal distractions, low consumer confidence, and high housing costs slow housing demand. As a result, new home sales totaled 478,221 on a seasonally adjusted annualized rate in November, down 35.9% compared to last year. Quick move-in inventory (QMI), homes that can likely be occupied within 90 days, are rising in response to the slower sales activity; national QMI levels are up 173.5% compared to last year and 51.7% compared to 2019.
A bright spot in the slower market is the recent downward pressure on mortgage rates. This is happening despite the continual increases in the short-term rate by the Federal Reserve. While rates are still in the 6% range, representing a doubling since the beginning of the year, they have been below 7.0% for five weeks now.
"There are a lot of reasons to fret about today's housing market given the uncertainty and lack of buyer urgency," said Ali Wolf, Zonda's chief economist. "There are some shoppers, however, that are responding favorably to strategic price cuts, incentives, and most importantly, quality. Homes that are thoughtfully designed, well located, and priced right are still selling, bucking the broader market slowdown."
Sales volume is back to 2016 levels
Zonda's new home sales metric counts the total number of new home contract sales each month and accounts for both cancellations and seasonality. This metric shows there were 478,211 new homes sold in November on a seasonally adjusted annualized rate. This was a decline of 10.6% from last month and a drop of 35.9% from a year ago. On a non-seasonally adjusted basis, 34,741 homes were sold, 38.5% lower than last year and 27.5% below the same month in 2019.
The PSI is off roughly 40% from cycle highs
Total volume is down due to both supply and demand. Zonda's New Home Pending Sales Index (PSI) was created to help account for fluctuations in supply by combining both total sales volume with the average sales rate per month per community. The November PSI came in at 104.0, representing a 38.1% decline from the same month last year. The index is currently 41.8% below cycle highs. On a month-over-month basis, seasonally adjusted new home sales increased 4.1%.
- For the fourth consecutive month, the PSI was up in just one of our select markets year-over-year, Baltimore.
- The metros that performed the worst year-over-year were Denver (-76.0%), Phoenix (-74.3%), and Salt Lake City (-63.2%).
- On a monthly basis, Salt Lake City, New York City, and San Francisco were the best-performing markets. Salt Lake City increased 21.4% relative to last month. Salt Lake City and San Francisco, for example, were two of the markets to slow the quickest earlier this year. The month-over-month uptick suggest the price drops and incentives are proving to be effective with consumers at some communities.
Home prices continue pattern of deceleration
National home prices increased year-over-year across entry-level, move-up, and high-end homes. Prices rose 11.1% for entry-level to $339,273, 9.6% for move-up to $527,221, and 7.8% for high-end homes to $904,085.
Supplementing our data with a monthly survey Zonda conducts, there were roughly 47% of homebuilders across the country that reported lowering prices month-over-month in November.
Incentives are increasingly common in today's housing market given the slower sales. 55.2% of active projects are offering to-be-built incentives, up from last month. The average incentive dollar amount is $12,642 or 3.7% of the list price.
Community count levels yet to rebound
There are currently 13,478 actively selling communities tracked by Zonda, down 7.2% from last year. On a month-over-month basis, the national figure fell 1.5%. Total community count is 29.6% below the same month in 2019.
- Las Vegas (+11.0%), Phoenix (+10.6%), and San Antonio (+7.7%) grew community count the most year-over-year.
- Community count fell the most in Baltimore (-25.3%), New York City (-21.3%), and Atlanta (-20.4%) relative to last year.
- 8% of our select markets rose month-over-month while 92% fell.
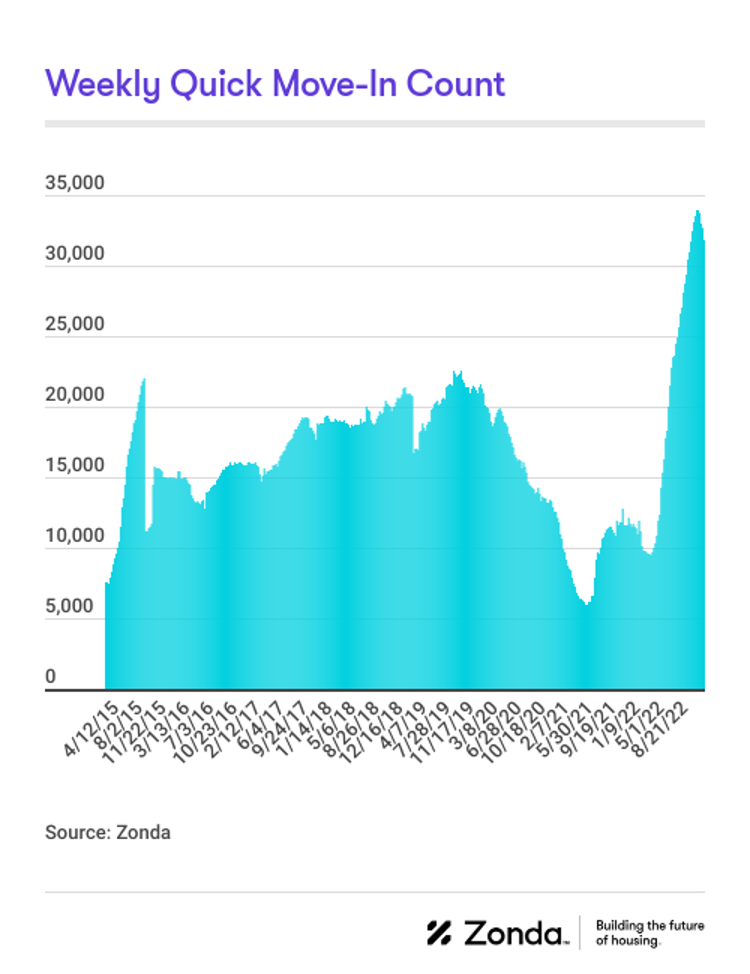
National quick move-ins (QMIs) totaled 31,789, up 173.5% compared to last year but 6.4% lower month-over-month. Total QMIs are 51.7% above 2019 levels. QMIs are homes that can likely be occupied within 90 days.
- On a metro basis, all of Zonda's select markets increased QMI count year-over-year.
- The markets posting the biggest gains were Tampa (+718.4%), Cincinnati (+577.1%), and Phoenix (+560.6%). QMIs in Tampa are roughly 43% above 2019 levels, 130% above in Cincinnati, and 171% higher in Phoenix.
- Salt Lake City, Jacksonville, and Phoenix have seen the most growth in QMIs compared to the same time in 2019, up 258.1%, 199.0%, and 171.5%, respectively.
Methodology
The Zonda New Home Pending Sales Index (PSI) is built on proprietary, industry-leading data that covers 60% of the production new home market across the United States. Reported number of new home pending contracts are gathered and analyzed each month. Released on the 15th business day of each month, the New Home PSI is a leading indicator of housing demand compared to closings because it is based on the number of signed contracts at a new home community. Zonda monitors 18,000 active communities in the country and the homes tracked can be in any stage of construction.
The new home market represents roughly 10% of all transactions, allowing little movements in supply to cause outsized swings in market activity. As a result, the New Home PSI blends the cumulative sales of activity recently sold out projects with the average sales rate per community, which adjusts for fluctuations in supply. Furthermore, the New Home PSI is seasonally adjusted based on each markets' specific seasonality, removes outliers, and uses June 2016 as the base month. The foundation of the index is a monthly survey conducted by Zonda. It is necessary to monitor both new and existing home sales to establish an accurate picture of the relative health of the residential real estate market.
Visit ZondaHome.com or follow us on LinkedIn and Facebook for more information.
About Zonda
Zonda provides data-driven housing market solutions to the homebuilding industry. From builders to building product manufacturers, mortgage clients, and multifamily executives, we work hand-in-hand with our customers to streamline access to housing data to empower smarter decisions. As a leading brand in residential construction, our mission is to advance the home building industry, because we believe better homes mean better lives and stronger communities. Together, we are building the future of housing.
Media Contact
Valerie Sheets, Zonda, 949-294-9557, [email protected]
SOURCE Zonda


Share this article