Tecplot RS 2019 R1 Lets Reservoir Engineers Analyze Well Path Trends
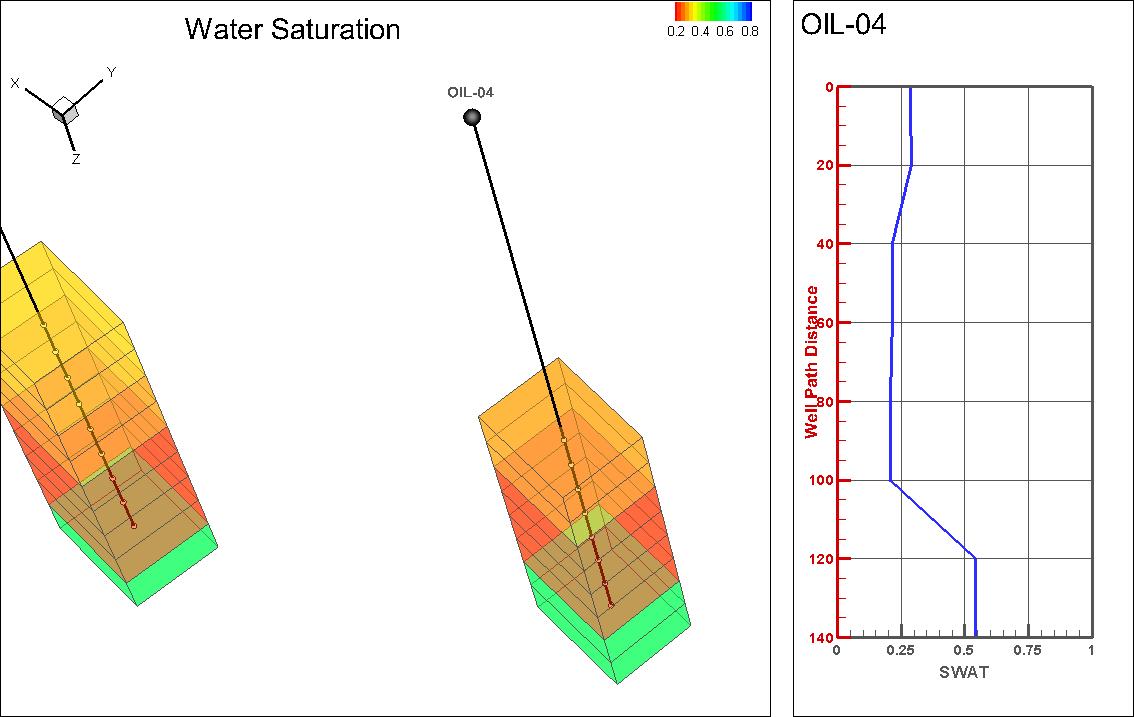
Well path feature in Tecplot RS easily plots grid-solution values along any well path.

BELLEVUE, Wash., Aug. 22, 2019 /PRNewswire-PRWeb/ -- Tecplot, Inc. has announced the general availability of Tecplot RS 2019 Release 1.
Advances in reservoir simulation have given reservoir engineers a more accurate electronic representation of their reservoir structure and fluid behavior. To fully understand trends throughout this data, more meaning must be extracted from post-simulation workflows.
Tecplot RS customers have asked for a function that will display the trends along a well path, whether the path is vertical, horizontal or deviated. Doing this will help them better understand how reservoir properties, such as pressure, are changing along that path.
New in Tecplot RS 2019 R1 is the Well Path capability. Now, users can interactively choose wells to see the well-path trend data. Activating the Well Path toggle (from the Tecplot RS sidebar) and clicking on any well will display a plot of the selected grid variable vs. well path distance in the quick frame.
An enhanced Modify Wells dialog makes the process of creating new wells easier and a bit more interactive. Users can manually enter the well node data for the new well in a spreadsheet.
"We are excited to introduce these new benefits to our customers and feel that this release is taking yet another step in meeting the constantly evolving needs of reservoir engineers using Tecplot RS." says Raja Olimuthu, Tecplot RS Product Manager. "The new Well Path capability and the improvements to the Well dialog will be more interactive and easier to use for our customers, giving them an even better experience while working in the product."
Tecplot RS 2019 R1 also received a tune up to the User Interface with an improved sidebar, a CMG SR3 reader update and minor bug fixes and enhancements.
About Tecplot RS
Tecplot RS helps engineers manage and analyze oil & gas reservoir simulation data. The software helps them uncover knowledge about reservoir model behavior thereby gaining confidence in making crucial decisions. The software allows users to evaluate a full range of results, including line graphs, 2D x-sections, and 3D grid plots.
More information about Tecplot RS can be found on the company's website, http://www.tecplot.com/rs/
About Tecplot, Inc.
Tecplot visualization and analysis software allows customers using desktop computers and laptops to quickly analyze and understand information hidden in complex data and communicate their results to others via professional images and animations. The company's products are used by more than 47,000 technical professionals around the world.
Contact:
Margaret Connelly
Marketing Manager, Tecplot, Inc.
[email protected]
(425) 653-1200
SOURCE Tecplot, Inc.

Share this article